

 Português
 Español
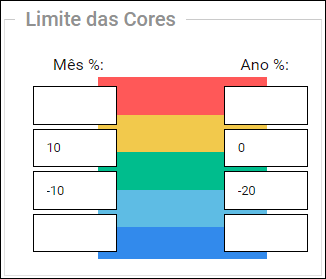
The colors of the months are simple, dynamically representing the result of that month according to the criteria defined in the configuration of the ranges or tolerance margins of the kpi.
REMINDER:
The colors of the months are defined by comparing the Actual to the Green and Red Ranges.
![]() Green: Result is within the plan. Measurement value is between the Lower and Upper Green Range. No analysis required.
Green: Result is within the plan. Measurement value is between the Lower and Upper Green Range. No analysis required.
![]() Yellow: Result between Green Lane and Red Lane for worse. In this case, the user should perform a FCA to assess what should be done to return to the green range (normality) or if the ranges should be revised.
Yellow: Result between Green Lane and Red Lane for worse. In this case, the user should perform a FCA to assess what should be done to return to the green range (normality) or if the ranges should be revised.
![]() Red: Result below the Red Range for worse. In this case, the user should perform a FCA to assess what should be done to return to the green range (normality) or if the ranges should be revised.
Red: Result below the Red Range for worse. In this case, the user should perform a FCA to assess what should be done to return to the green range (normality) or if the ranges should be revised.
![]() Blue: Result between Green Lane and Red Lane for the better. In this case, the user should perform a FCA to assess what should be done to return to the green range (normality) or whether the ranges should be revised.
Blue: Result between Green Lane and Red Lane for the better. In this case, the user should perform a FCA to assess what should be done to return to the green range (normality) or whether the ranges should be revised.
![]() Oil Blue: Result below the Red Band for better. In this case, the user should perform an FCA to assess what should be done to return to the green range (normality) or if the ranges should be revised.
Oil Blue: Result below the Red Band for better. In this case, the user should perform an FCA to assess what should be done to return to the green range (normality) or if the ranges should be revised.
![]() White: Measurement not reported. If your item uses the summation function and is blank, it means that one of the child items is not being measured.
White: Measurement not reported. If your item uses the summation function and is blank, it means that one of the child items is not being measured.
IMPORTANT:
If your results constantly fall outside your Green Range, they may turn red as a result of Chronic Red.
Here is how to configure the ranges according to the item type:
For items of type 1C you set the Green range and the Red range in the item measurement.

For items of type 2A, 2B and 2C the Green Range and Red Range must be defined in the item master data, in the Item Type tab.
For these items it is necessary to register the Track Limits.