

 Português
[/et_pb_text][et_pb_text disabled_on=”on|on|” admin_label=”Artigos Relacionados” _builder_version=”4.9.2″ text_font=”|600|||||||” text_text_color=”#727272″ header_line_height=”1.1em” header_2_font=”|800||||on|||” header_2_text_align=”left” header_2_text_color=”#494949″ header_3_font=”|600|||||||” header_3_text_color=”#494949″ header_3_font_size=”14px” header_3_line_height=”1.2em” module_alignment=”left” z_index_tablet=”500″ text_text_shadow_horizontal_length_tablet=”0px” text_text_shadow_vertical_length_tablet=”0px” text_text_shadow_blur_strength_tablet=”1px” link_text_shadow_horizontal_length_tablet=”0px” link_text_shadow_vertical_length_tablet=”0px” link_text_shadow_blur_strength_tablet=”1px” ul_text_shadow_horizontal_length_tablet=”0px” ul_text_shadow_vertical_length_tablet=”0px” ul_text_shadow_blur_strength_tablet=”1px” ol_text_shadow_horizontal_length_tablet=”0px” ol_text_shadow_vertical_length_tablet=”0px” ol_text_shadow_blur_strength_tablet=”1px” quote_text_shadow_horizontal_length_tablet=”0px” quote_text_shadow_vertical_length_tablet=”0px” quote_text_shadow_blur_strength_tablet=”1px” header_text_shadow_horizontal_length_tablet=”0px” header_text_shadow_vertical_length_tablet=”0px” header_text_shadow_blur_strength_tablet=”1px” header_2_text_shadow_horizontal_length_tablet=”0px” header_2_text_shadow_vertical_length_tablet=”0px” header_2_text_shadow_blur_strength_tablet=”1px” header_3_text_shadow_horizontal_length_tablet=”0px” header_3_text_shadow_vertical_length_tablet=”0px” header_3_text_shadow_blur_strength_tablet=”1px” header_4_text_shadow_horizontal_length_tablet=”0px” header_4_text_shadow_vertical_length_tablet=”0px” header_4_text_shadow_blur_strength_tablet=”1px” header_5_text_shadow_horizontal_length_tablet=”0px” header_5_text_shadow_vertical_length_tablet=”0px” header_5_text_shadow_blur_strength_tablet=”1px” header_6_text_shadow_horizontal_length_tablet=”0px” header_6_text_shadow_vertical_length_tablet=”0px” header_6_text_shadow_blur_strength_tablet=”1px” box_shadow_horizontal_tablet=”0px” box_shadow_vertical_tablet=”0px” box_shadow_blur_tablet=”40px” box_shadow_spread_tablet=”0px” saved_tabs=”all” locked=”off”]
Related Posts
[/et_pb_text][/et_pb_column][et_pb_column type=”3_5″ _builder_version=”3.25″ custom_padding=”|||” custom_padding__hover=”|||”][et_pb_post_title meta=”off” featured_image=”off” _builder_version=”3.19.18″ title_font=”|700||||on|||” title_font_size=”36px” border_width_bottom=”5″ border_color_bottom=”#0c71c3″][/et_pb_post_title][et_pb_text admin_label=”Info” _builder_version=”4.9.7″ text_font=”||on||||||” text_font_size=”12px” text_letter_spacing=”1px” text_line_height=”1.5em” custom_margin=”-40px|0px||” custom_margin_tablet=”-20px|0px||” custom_margin_phone=”” custom_margin_last_edited=”on|desktop” custom_padding=”0px|0px||” z_index_tablet=”500″]
Some KPIs can have various levels of totalization, that is, totalizing KPIs that are totaled. Thinking about it, Qualitin developed the totalization by levels.
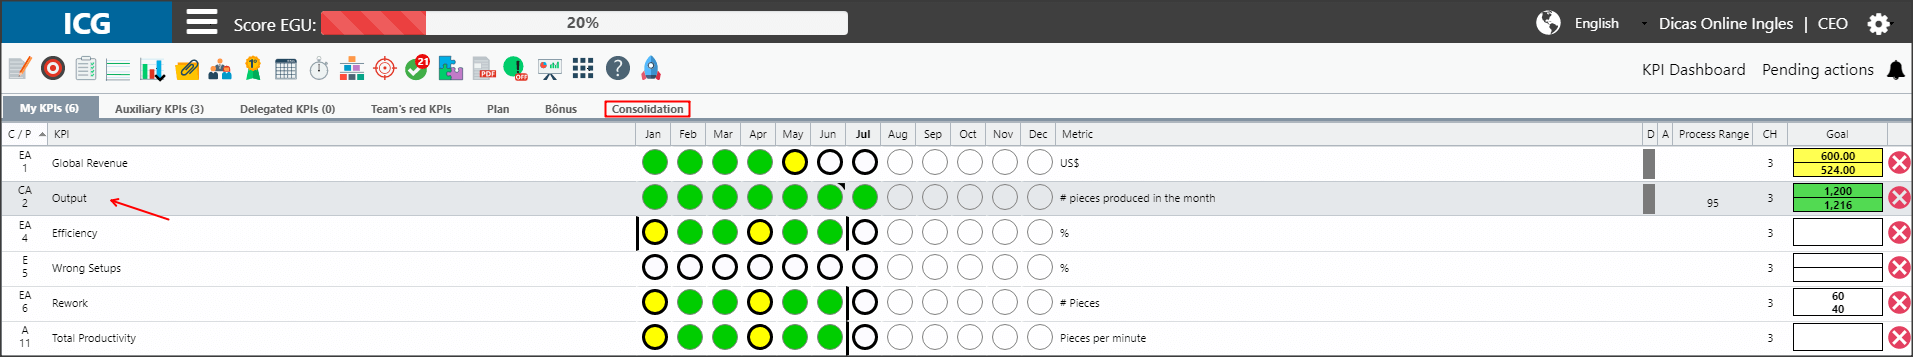
[/et_pb_text][et_pb_text _builder_version=”4.9.7″ custom_margin=”-10px||0px|” custom_padding=”|25px||25px” hover_enabled=”0″ border_color_top=”#0c71c3″ sticky_enabled=”0″]The totalization KPIs will be marked with a gray icon in column D of your dashboard:
![]()
To view the levels, just click on your KPI and the “Totalization” tab will appear.
IMPORTANT:
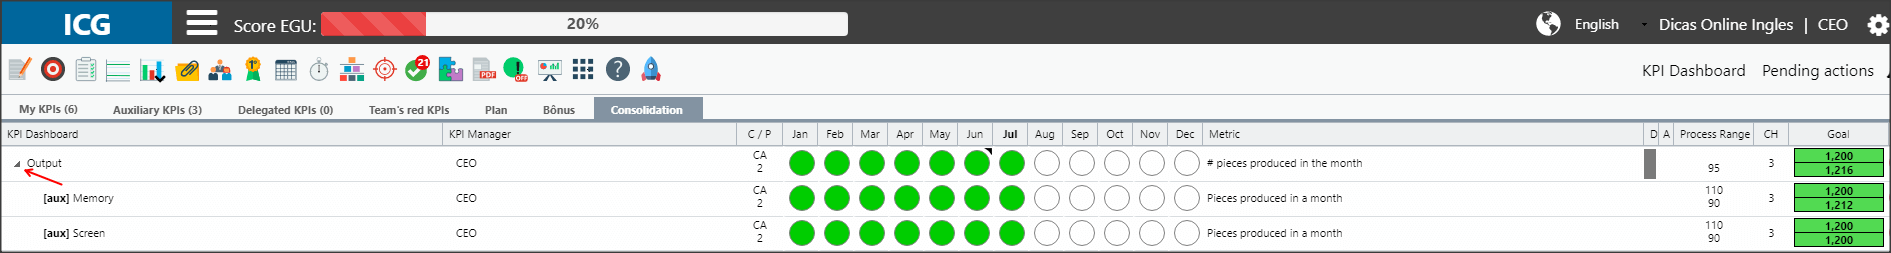
Note that all KPIs are of type 1C and the “Add Values and Bands” function was used. In this case, the value of the Green Band of the totalized KPI will be as explained in the Types of Totalization article.
When you click on the “Totalization” tab, the totalization will appear. To view the other levels of totalization, just click on the arrow indicated below, and it will open in a cascade.
[/et_pb_text][et_pb_text admin_label=”Borda Inferior” _builder_version=”3.27.4″ custom_margin=”0px||20px|” custom_padding=”|25px||25px” box_shadow_style=”preset3″]TESTE
[/et_pb_text][/et_pb_column][et_pb_column type=”1_5″ _builder_version=”3.25″ custom_padding=”|||” custom_padding__hover=”|||”][et_pb_image src=”https://suporte.quattrus.com/wp-content/uploads/2021/03/Artboard-2-copy-5.jpg” title_text=”Artboard 2 copy 5″ align_tablet=”center” align_phone=”” align_last_edited=”on|desktop” disabled_on=”on|on|” admin_label=”ESP – Banner – Contato Suporte” _builder_version=”4.9.2″ z_index=”0″ always_center_on_mobile=”on” saved_tabs=”all” locked=”off”][/et_pb_image][et_pb_image src=”https://suporte.quattrus.com/wp-content/uploads/2021/03/Prancheta-1.jpg” title_text=”Prancheta 1″ url=”https://www.qualitin.com.br/consultoria/” url_new_window=”on” align_tablet=”center” align_phone=”” align_last_edited=”on|desktop” disabled_on=”on|on|” admin_label=”Banner – Consultoria” _builder_version=”4.9.2″ max_width=”100%” saved_tabs=”all” locked=”off”][/et_pb_image][/et_pb_column][/et_pb_row][/et_pb_section]