

 Português
 Español
Artigos Relacionados
[/et_pb_text][/et_pb_column][et_pb_column type=”3_5″ _builder_version=”3.25″ custom_padding=”|||” global_colors_info=”{}” custom_padding__hover=”|||”][et_pb_post_title meta=”off” featured_image=”off” _builder_version=”3.19.18″ title_font=”|700||||on|||” title_font_size=”36px” border_width_bottom=”5″ border_color_bottom=”#0c71c3″ global_colors_info=”{}”][/et_pb_post_title][et_pb_text admin_label=”Info” _builder_version=”3.27.4″ text_font=”||on||||||” text_font_size=”12px” text_letter_spacing=”1px” text_line_height=”1.5em” custom_margin=”-35px|0px||” custom_margin_tablet=”-25px||44px|” custom_margin_phone=”” custom_margin_last_edited=”on|tablet” custom_padding=”0px|0px||” z_index_tablet=”500″ global_colors_info=”{}” custom_margin__hover_enabled=”on” custom_margin__hover=”-35px|0px||”]
Esta melhoria foi implementada a partir do dia 06/04/2019.
As abas de Totalização e de Vinculação de Itens de Controle mudou!
Ao invés de visualizar os níveis de Totalização ou de Vinculação em abas, o ICG agora exibe todos os detalhes da estrutura em forma de cascata. Com essa nova forma de visualização você vai visualizar mais facilmente a relação hierárquica entre os itens de controle em seus diversos níveis.
Ao abrir uma nova aba de totalização ou de vinculação, você terá uma seta que indica que abaixo daquele item existem outros itens relacionados. De acordo com a estrutura criada, você poderá navegar facilmente entre todos os níveis da estrutura, visualizando os itens e seus resultados de forma rápida, dinâmica e intuitiva.
[/et_pb_text][et_pb_text _builder_version=”3.27.4″ background_color=”rgba(70,168,201,0.34)” custom_margin=”-25px|54px||37px” custom_padding=”10px|15px|10px|20px|true” border_width_left=”5px” border_color_left=”rgba(32,159,201,0.59)” box_shadow_style=”preset3″ saved_tabs=”all” global_colors_info=”{}”]IMPORTANTE:
O ICG trata as totalizações e vinculações de forma separada, ou seja, existe
uma aba para exibir as Totalizações e outra aba para exibir as Vinculações.
Neste artigo veremos:
[/et_pb_text][et_pb_text admin_label=”Tópico 1″ module_id=”topic_01″ _builder_version=”3.27.4″ text_font=”||||||||” text_letter_spacing=”1px” header_font=”|||||on|||” header_text_color=”#474747″ header_3_font=”|||||on|||” custom_margin=”30px|0px|10px|0px||true” custom_padding=”10px|||10px||false” border_color_all=”#0c71c3″ border_width_bottom=”3px” border_width_left=”3px” global_colors_info=”{}”]Visualização de uma Totalização de itens
[/et_pb_text][et_pb_text _builder_version=”3.27.4″ custom_margin=”|25px|0px|25px||true” custom_padding=”||0px” global_colors_info=”{}”]Clique em um item que possua uma totalização. Neste exemplo, vamos clicar no Item 7 do usuário 5.
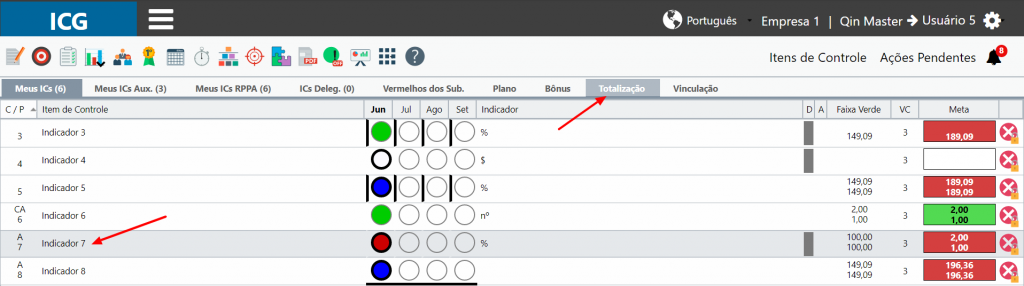
Clique na aba de Totalização.
Você verá que há dois itens totalizando o Item 7: o Item 4 e o Item 6.
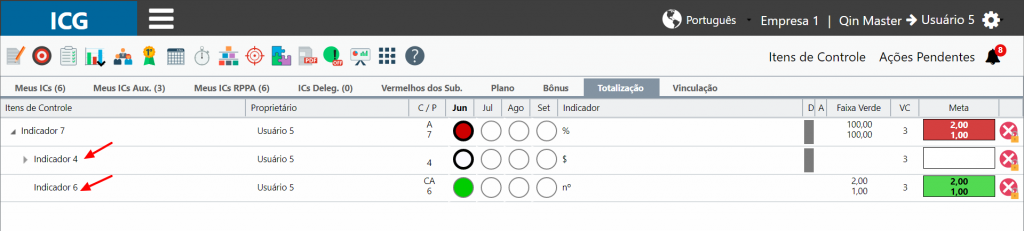
Perceba que no Item 4 também há uma seta à esquerda do nome do item. Isto significa que este item de controle também contém uma totalização no nível inferior. Clique na seta do Item 4 para expandir e visualizar os itens que compõem essa totalização.
Em casos onde existem mais níveis de totalização, basta ir clicando nas setas dos itens para expandir e visualizar os itens de controle dos níveis abaixo. À medida que a estrutura for se expandindo, você vai percebendo de que forma os itens se relacionam em uma única tela.
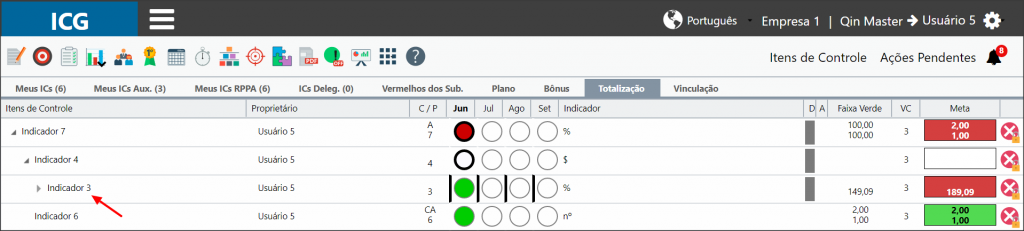
Note agora que o Item 3 está com a coluna D marcada, o que indica que nesses itens existe um desdobramento (uma Totalização ou Vinculação). Porém, como não há uma seta para expandir a visualização da totalização, isto significa que estes itens possuem apenas Vinculação com outros itens de controle.
Para visualizar a Vinculação dos itens Item 2 e Item 3, você deve acessar primeiramente o dashboard do dono do item (Usuário 5), clicar no respectivo item e clicar na aba Vinculação.
[/et_pb_text][et_pb_text _builder_version=”3.27.4″ background_color=”rgba(70,168,201,0.34)” custom_margin=”|65px||134px” custom_padding=”10px|15px|10px|20px|true” border_width_left=”5px” border_color_left=”rgba(32,159,201,0.59)” box_shadow_style=”preset3″ saved_tabs=”all” global_colors_info=”{}”]
IMPORTANTE:
Na aba de TOTALIZAÇÃO só é possível visualizar os dados dos itens TOTALIZADOS.
Na aba de VINCULAÇÃO só é possível visualizar os dados dos itens VINCULADOS.
TESTE
[/et_pb_text][et_pb_text admin_label=”Tópico 2″ module_id=”topic_02″ _builder_version=”3.27.4″ text_font=”||||||||” text_letter_spacing=”1px” header_font=”|||||on|||” header_text_color=”#474747″ header_3_font=”|||||on|||” custom_margin=”30px|0px|10px|0px||true” custom_padding=”10px|||10px||false” border_color_all=”#0c71c3″ border_width_bottom=”3px” border_width_left=”3px” global_colors_info=”{}”]Visualização de uma Vinculação de itens
[/et_pb_text][et_pb_text _builder_version=”3.27.4″ custom_margin=”|25px|0px|25px||true” custom_padding=”||0px” global_colors_info=”{}”]Neste exemplo, vamos clicar no Item 7.
Ao clicar na aba Vinculação, você verá a mesma estrutura em cascata vista no exemplo anterior.
Para visualizar todos os níveis de vinculação, basta ir clicando nas setas para expandir a visualização.
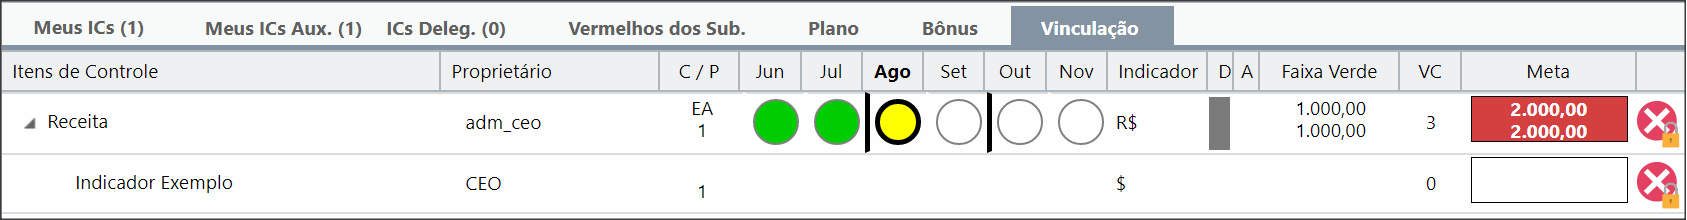
Note que o Item: Indicador do Usuário 3 está com a marcação na coluna D (de desdobramento). Como não há seta para expandir a visualização da estrutura, significa que este item é totalizado.
Para visualizar a Totalização do Item: Indicador, você deve acessar primeiramente o dashboard do dono do item (Usuário 3), clicar no respectivo item em seguida clicar na aba Totalização.
[/et_pb_text][et_pb_text admin_label=”Borda Inferior” _builder_version=”3.27.4″ custom_margin=”10px|-13px|40px|-1px” custom_padding=”|25px||25px” box_shadow_style=”preset3″ global_colors_info=”{}”]TESTE
[/et_pb_text][/et_pb_column][et_pb_column type=”1_5″ _builder_version=”3.25″ custom_padding=”|||” global_colors_info=”{}” custom_padding__hover=”|||”][et_pb_image src=”https://suporte.quattrus.com/wp-content/uploads/2019/02/banner-suporte-01.png” title_text=”banner-suporte-01″ url=”http://www.qualitin.com.br/consultoria/?utm_source=claussuffert.com.br&utm_medium=banner&utm_campaign=consultoria&utm_content=artigo-lateral” align_tablet=”center” align_phone=”” align_last_edited=”on|desktop” disabled_on=”on|on|” admin_label=”ESP – Banner – Contato Suporte” _builder_version=”4.14.4″ z_index=”0″ always_center_on_mobile=”on” global_module=”10498″ saved_tabs=”all” locked=”off” global_colors_info=”{}”][/et_pb_image][/et_pb_column][/et_pb_row][/et_pb_section]