

 Português
 Español
After you have logged in, it is time to register your KPIs. Click on the Three Dots icon and on Add KPIs.
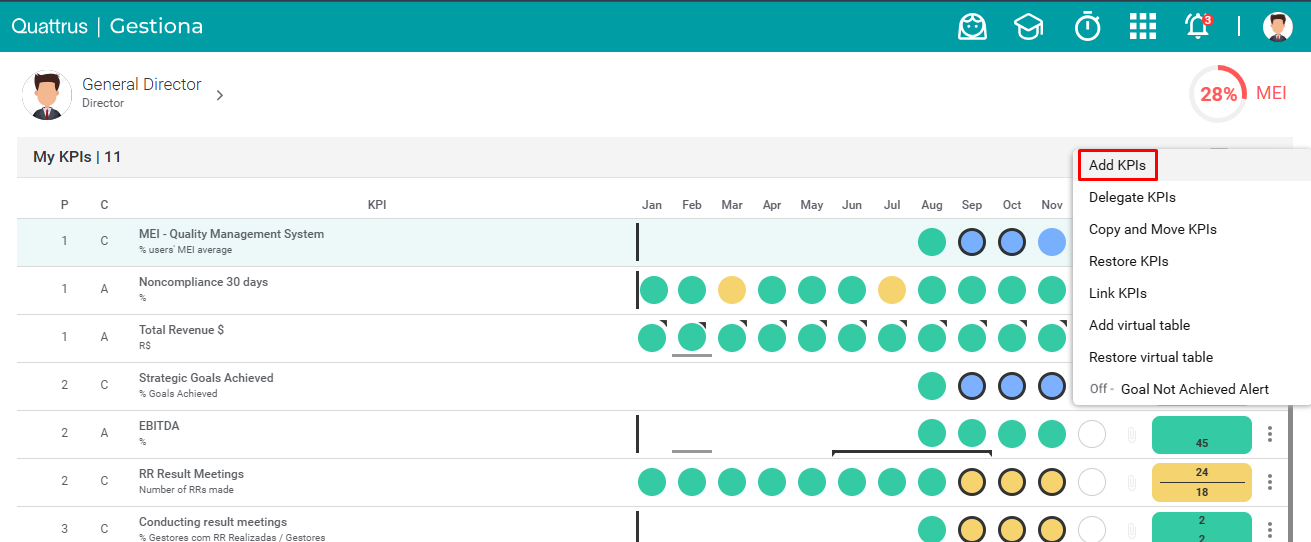
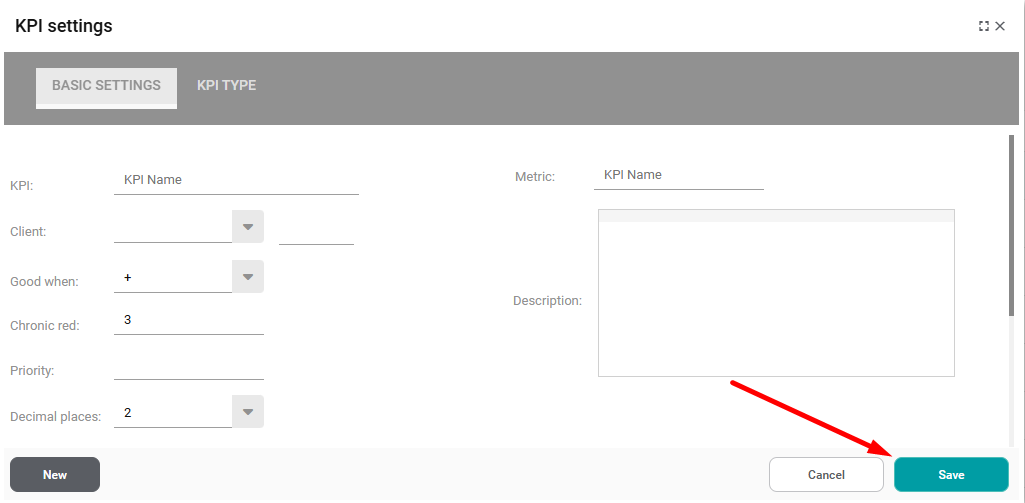
The system will open the KPI Settings screen.
If you already have KPIs registered, click New to add a KPI.

See on the next tabs how to fill in your KPI.
After finishing your KPI, click on SAVE.
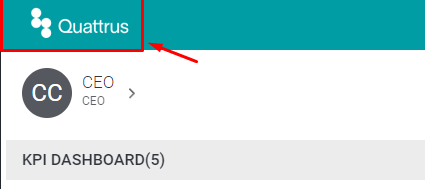
Click on the Quattrus icon to refresh your page.
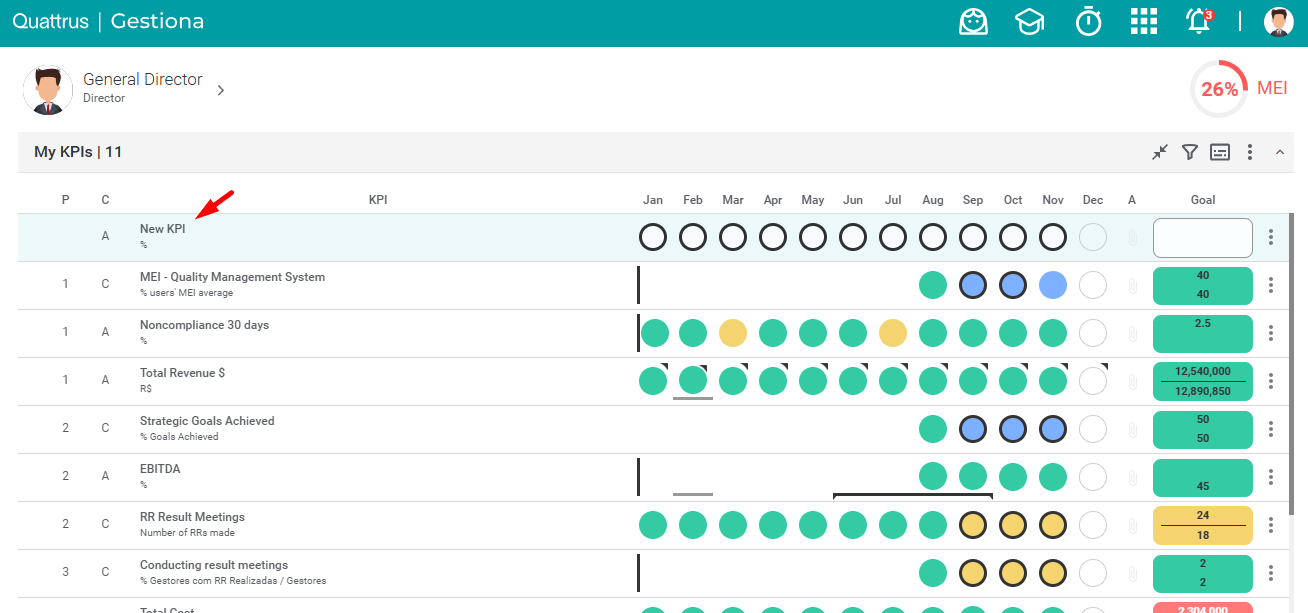
The KPI will appear on your Dashboard.
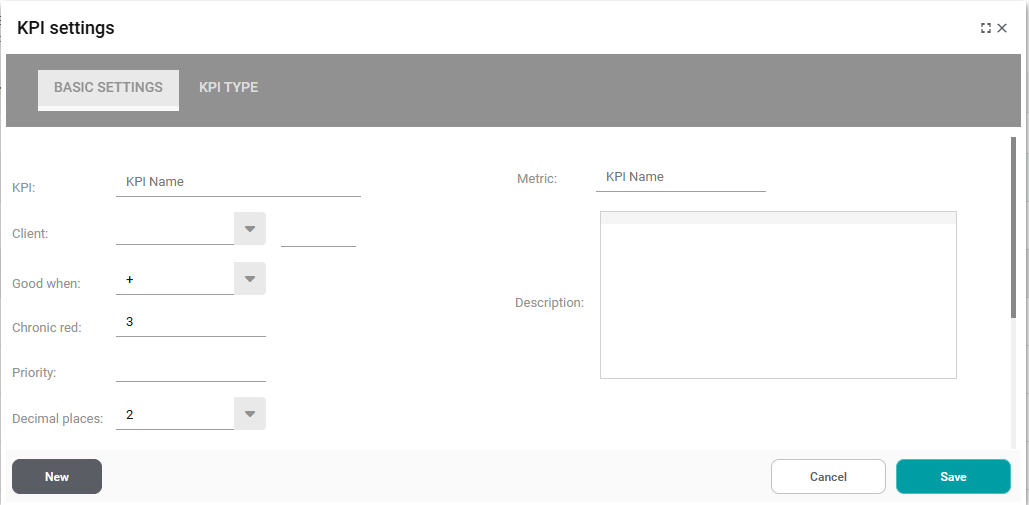
Complete the required fields:
- Code: Unique number of a KPI, automatically generated when registered.
- KPI: KPI Name.
- Metric: Unit being used to measure the KPI.
- Description: Field to insert description of KPI
- Client: Who is the main stakeholder of your KPI.
- Good when: Indicates when the value is good. It can be for MORE (+), for LESS (-) or for SAME (=).
- Chronic red: Number of months out of range before being considered Chronic Red.
- Priority: Defines the order of your KPIs on the dashboard.
- Decimal places: Number of decimal places considered for the KPI values.
- Coefficient: Value by which the KPI values will be multiplied. Quattrus default is 1.
- Auxiliary: Changes the KPI to Auxiliary.
- Validity of the KPI: Defines a START or END date for the management of each indicator in Quattrus.
- Auxiliary Fields: Custom fields of the KPI previously configured by the Client Administrator.
- Benchmark: Reference value for the purpose of comparison with your KPI. This data will be displayed in the KPI chart.
- KPI Description: In the description you can write a text detailing the particularities of your KPI.
Before you can register a KPI, we need to understand what each field means.
1C Type KPI:
- Green Range/Process Range: It represents what you usually achieve.
- Red Range: When the Red Range is exceeded, it is a problem, it means a result well outside the expected range. The reason for this result must be analyzed alongside the manager.
- Client Range/Goal: It is the goal you want to achieve.
In this type of KPI, you can enter lower and upper values for each of the Ranges. By checking the chart, it is easier to understand and visualize the limits of each range.
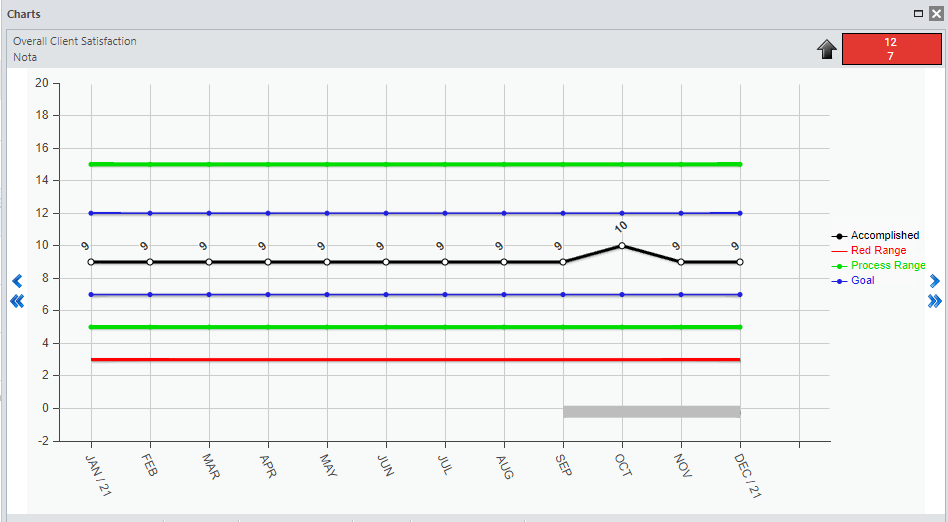
Let’s analyze the example above:
The Green Range values are between 5 and 15, which means the user usually get results between 5 and 15. If any results are outside this range, an analysis (FCA) should be done to detect the causes for the month’s accomplished not being within the predicted range.
The Lower Red Range has a value of 3, that is, all values that are below this value should be analyzed together with the manager. It needs immediate analysis.
The same goes for the Upper Red Range, all values above 18 must be analyzed with the manager.
Between the Green and Red Ranges, we have the Yellow Range, a warning range.
In our example, the Lower Yellow Range contains the results between 3 and 5, and the Upper Yellow Range contains the results between 15 and 18.
When the headlight of the month is yellow, the analysis of the result should also be done, but the manager’s assistance is not required.
The Client Range is the goal, what we would like to see as the result.
In this example, the KPI is not meeting its goal, since the Lower Green Range is below the Lower Client Range. It will be necessary to make an Action Plan to improve the results of this item, so that at the end of the plan the results are reaching the established target.
2A, 2B and 2C KPI Types:
- Forecast: It represents what you are used to achieving, it is what you are planning to accomplish each month.
- Budget: It is the goal you want to achieve, it is what you would like to accomplish.
These KPI types work with %. When registering the item, you will indicate a % limit for each range.
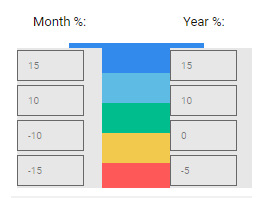
In this case the limit for the month will be applied to the Forecast field. If the Forecast amount for the month is 100, the Green Range will be between 110 and 90 (10% more and less), the Lower Red Range will be 85 (15% less), and the Upper Red Range will be 115 (15% more).
Between 85 and 90 will be the Lower Yellow Range and between 110 and 115 will be the Upper Yellow Range.
The same goes for the Year, however the reference value will be the one in the Budget column.
Remember that the limits for the month and the year don’t have to be the same.
On the KPI TYPE tab you can define how the Green Range and the Goal of your KPI will be configured.

Often, the metrics of a KPI depends on other items. On the “Consolidation” tab, you can sum up your KPI using the following functions:
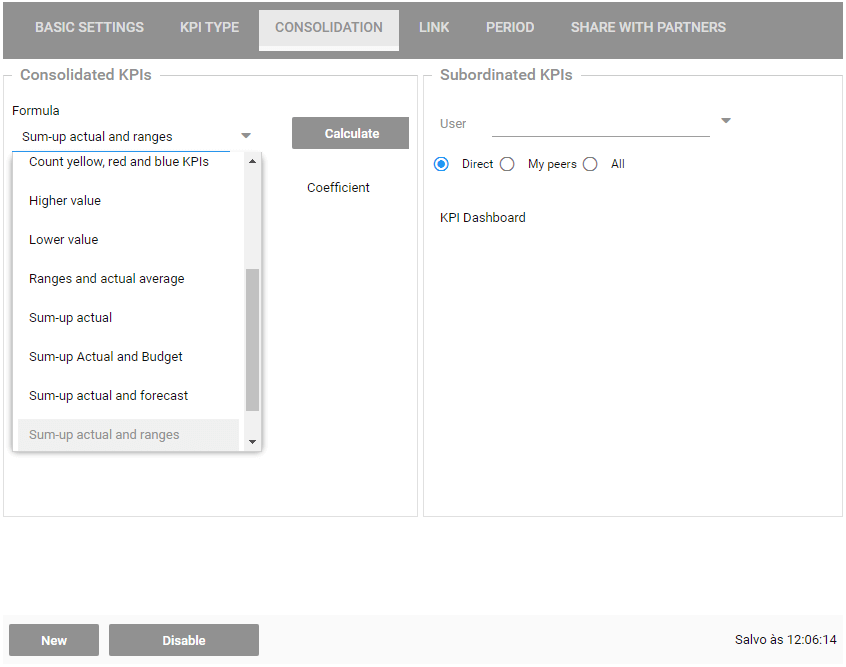
When an item is consolidated, it will be shown on the KPIs Dashboard.
Unlike Totalization, linked KPIs will not affect your metrics. They are reference KPIs, for analyzing your metrics, but they will not automatically influence your metrics.
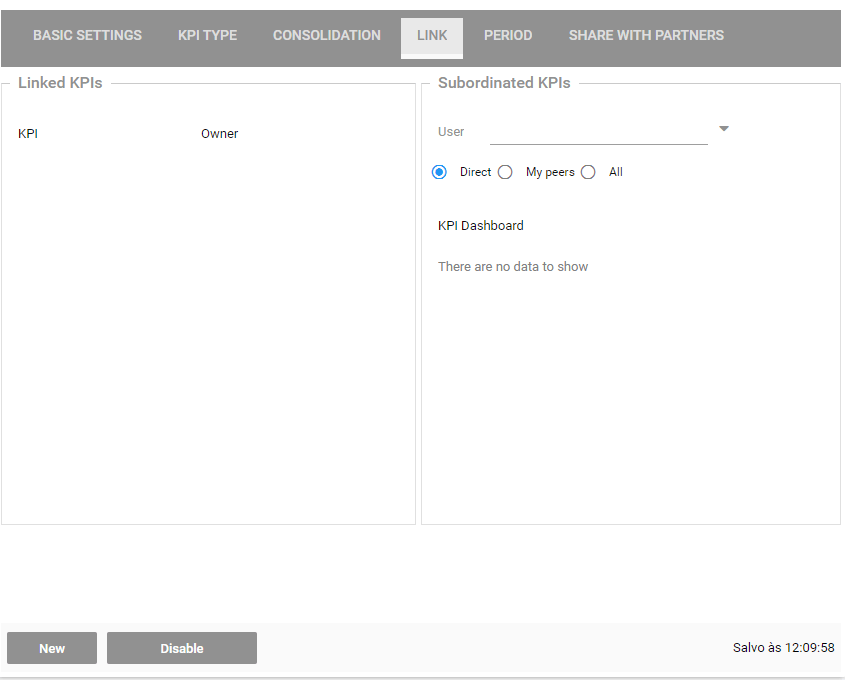
As with consolidated KPIs, KPIs that are linked will also be indicated in the KPI panel.
By default, Quattrus registers KPIs from January to December, but you can change the duration of an item on the “Period” tab.
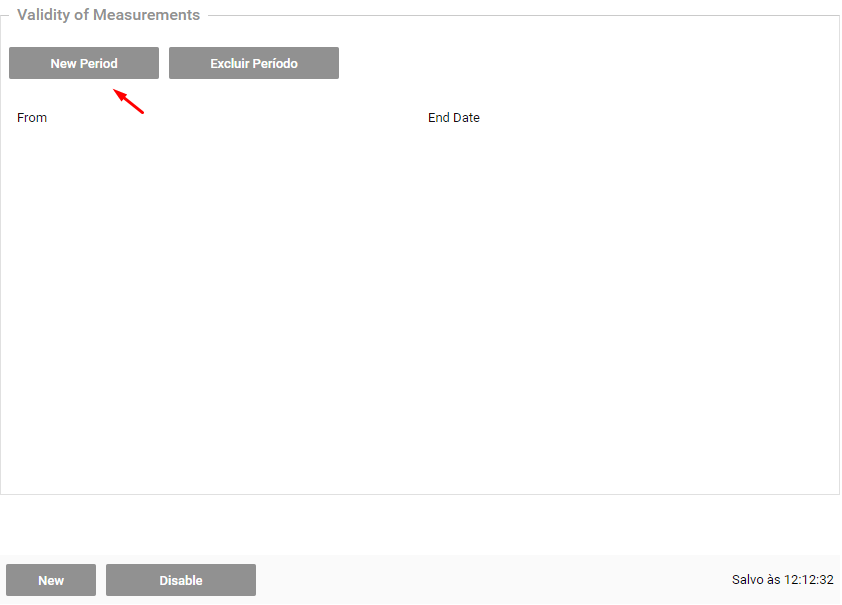
Attention: Changing the period will change the calculation of the Goal for types 2A and 2B.
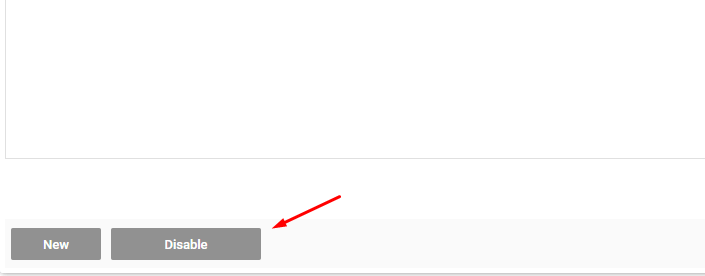
When you disable a KPI, it will no longer be visible in your dashboard. To disable an item, simply go to the KPI Settings and click “Disabled”.
To Restore KPIs, click on the icon indicated below and select the “Restore KPIs” option.
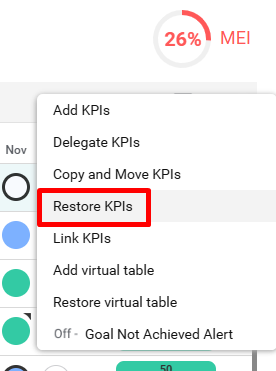
Select the KPI and click on Restore.
