

 Português
 Español
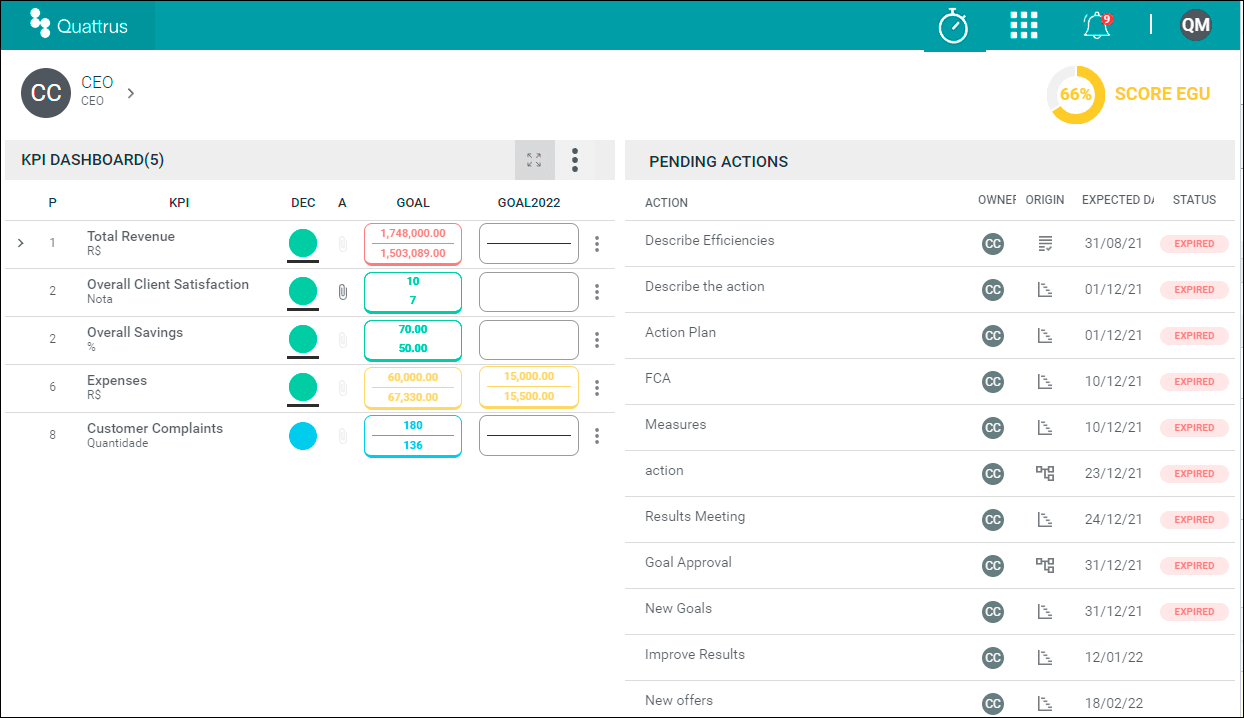
This article will provide an overview of the Dashboard. We will take a look at the tools you can use to improve your productivity in any area you want optimized results.
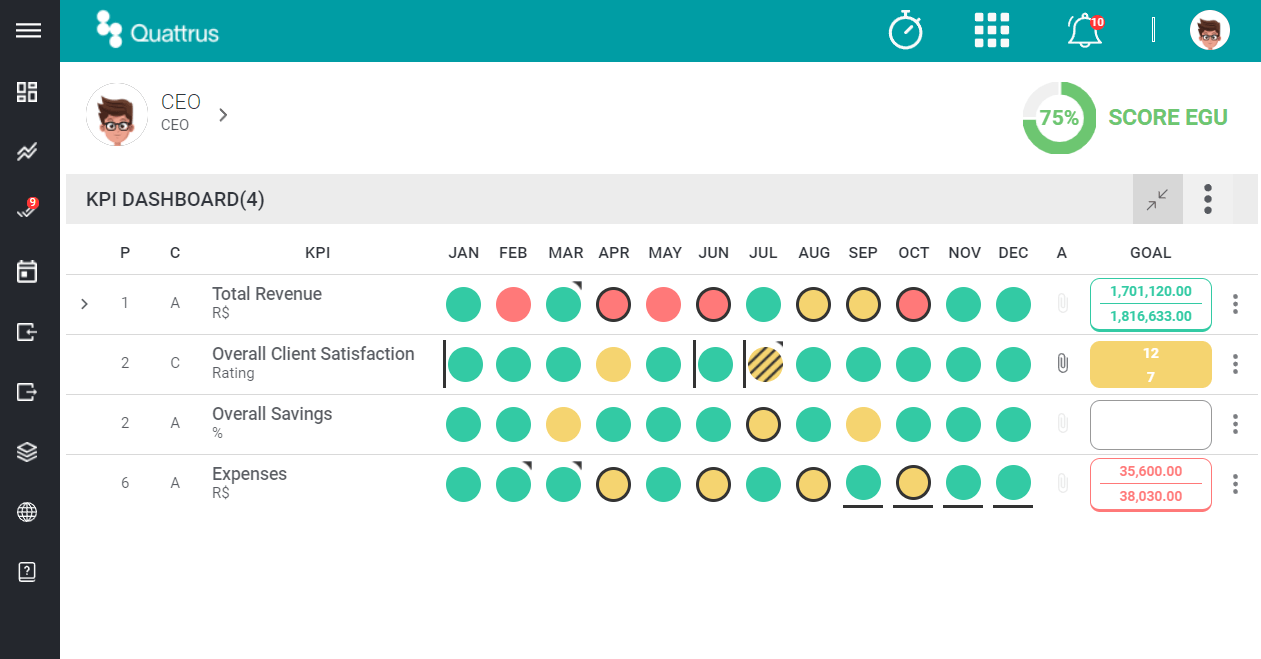
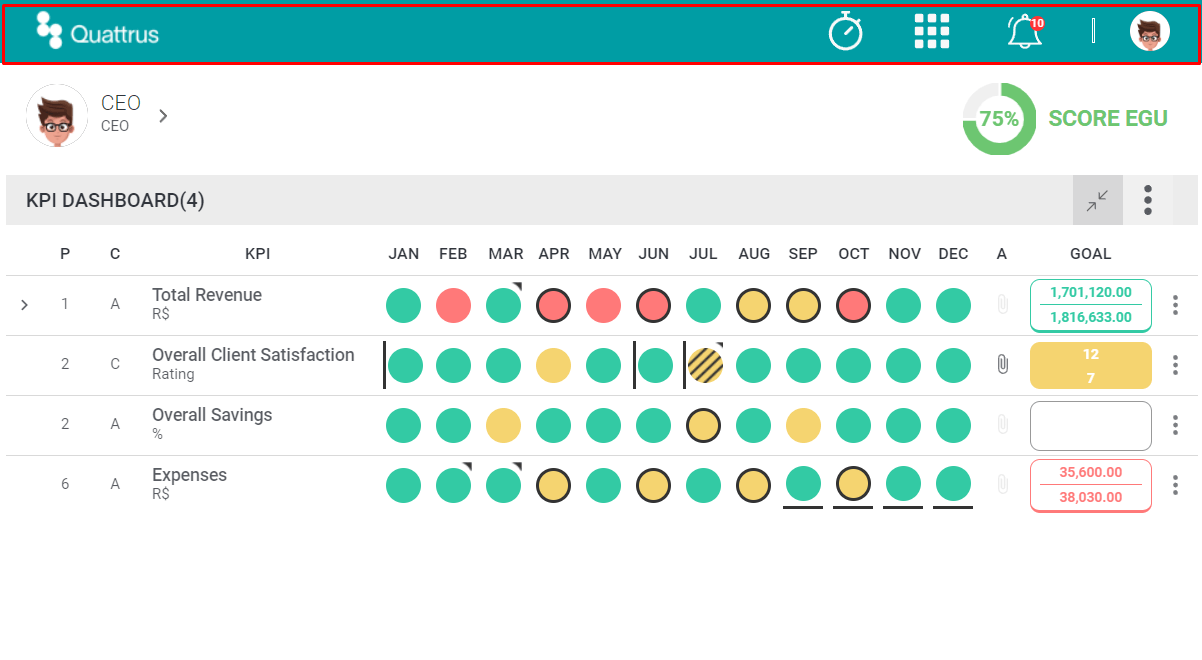
User features can be found on the top bar.
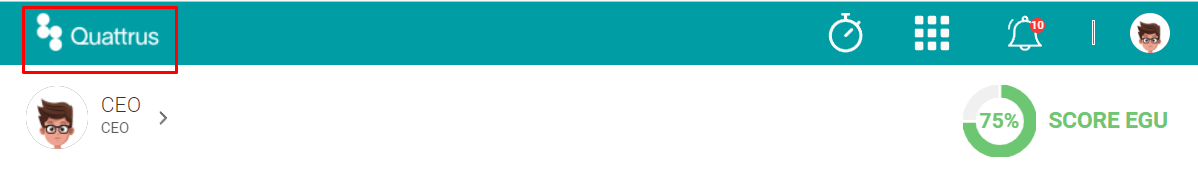
When you click on Quattrus icon, the system will return to the main dashboard or refresh the main dashboard.
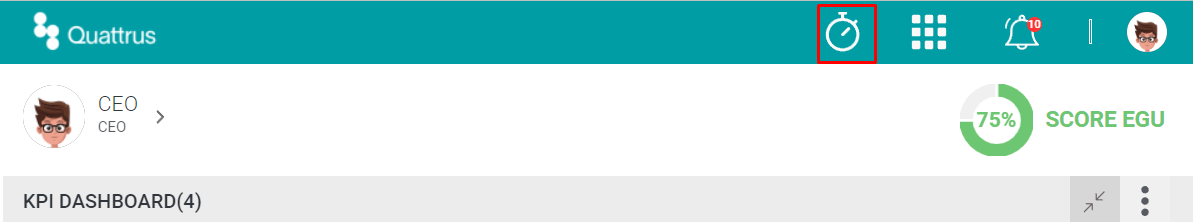
On this icon, we have a timer
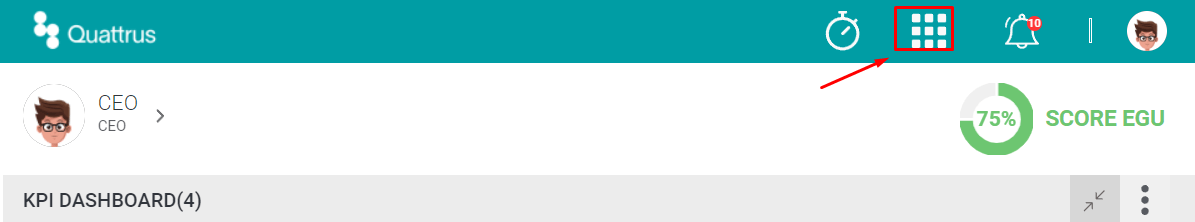
On this icon we have a few systems that are associated to Quattrus.
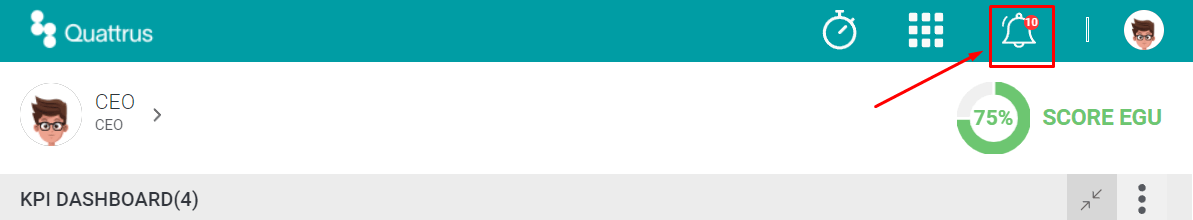
Here we have delegated actions and pending actions icon.
On the top right corner, you will see your profile icon.
Click on the profile icon to see information about the user.
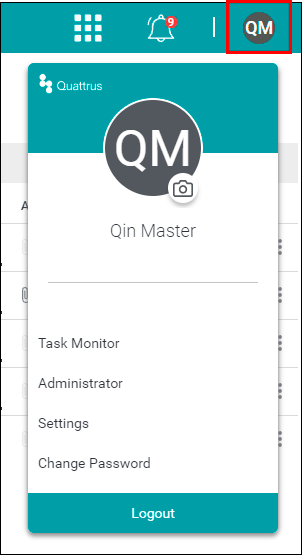
- Task Monitor – Configure notifications and system warnings.
- Administrator – This option will only be available if you have access to the System Administrator environment. Click on this option to be redirected to the Admin panels.
- Settings – Here you can change the user configuration or how many months are shown on your dashboard.
- Change Password – It allows you to change you password.
- Logout – Closes your current session.
The Dashboard features can be found below the top bar.
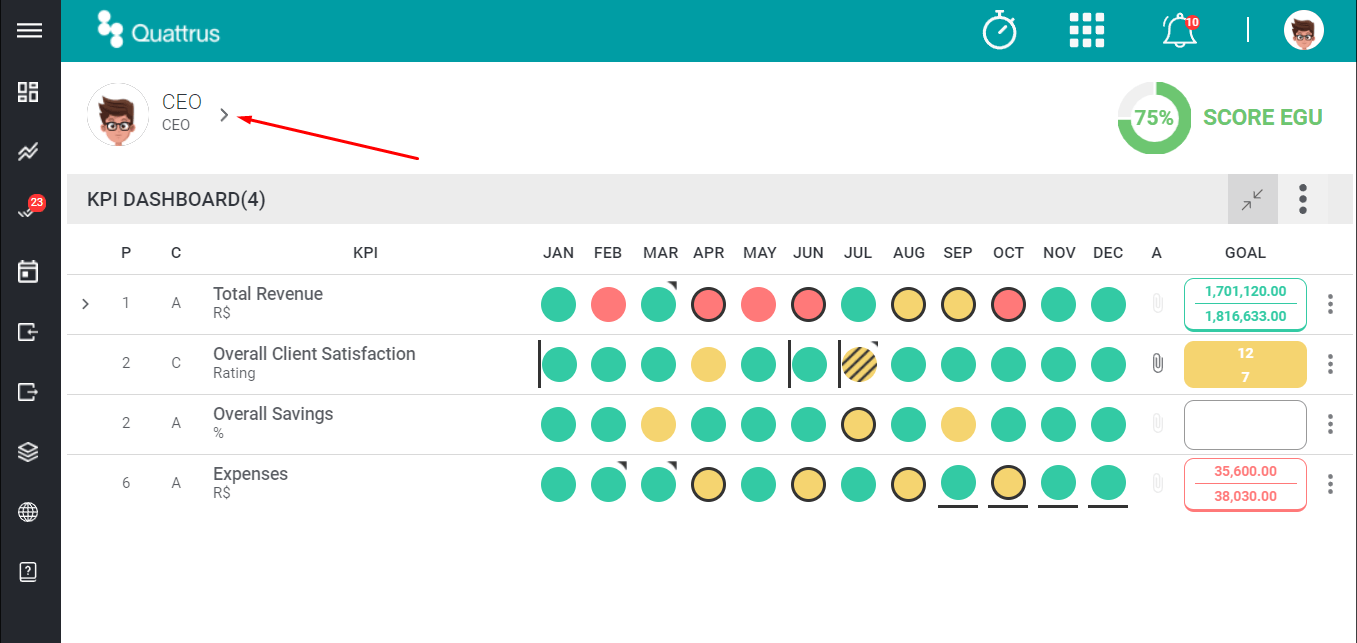
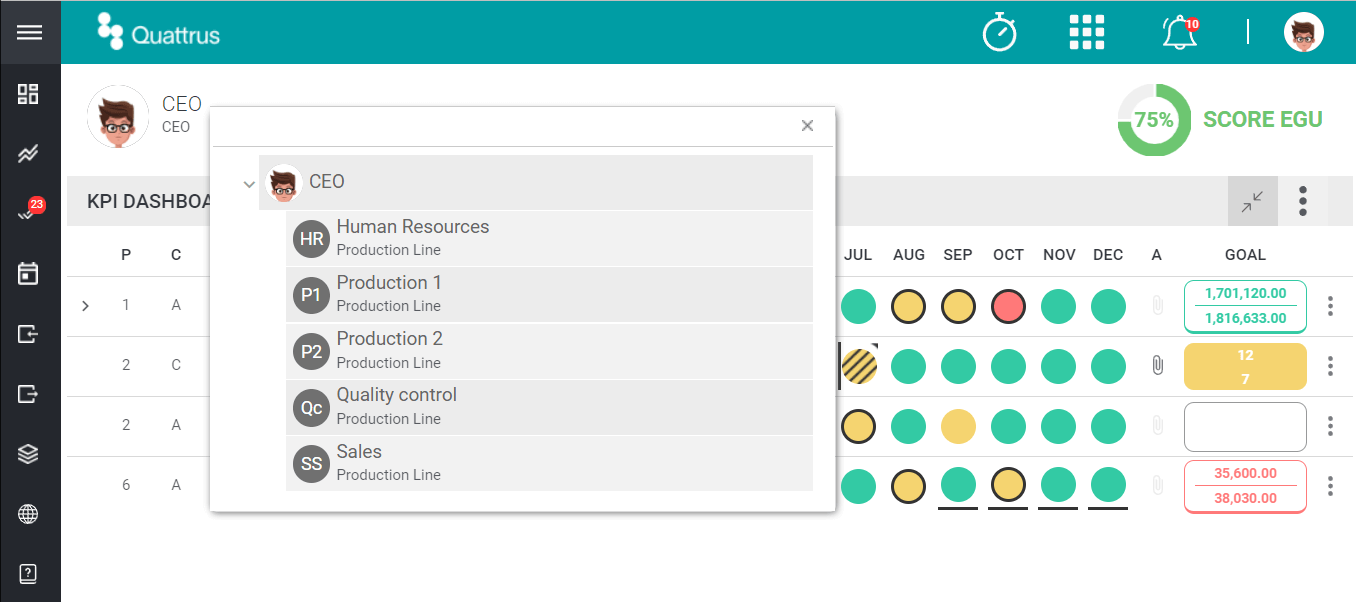
Clicking on the location shown above, you will access your team structure tree, as you can see in the picture below.
Clicking on the arrows on the side of each name will expand or collapse the tree. Clicking on an user name will open their dashboard.
MEI (Management Evolution Index) is a metric that evaluates how well the users apply this methodology.
Quattrus has a MEI Score, which allows the user to check its performance in real time as the MEI criteria are met.
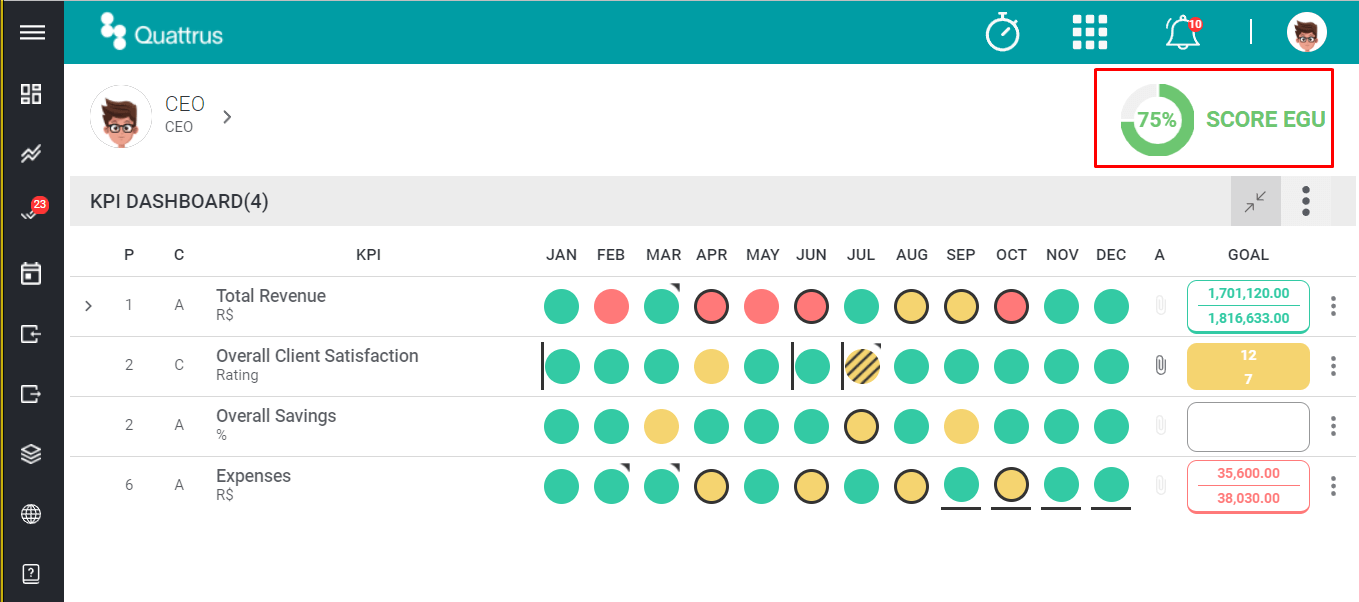
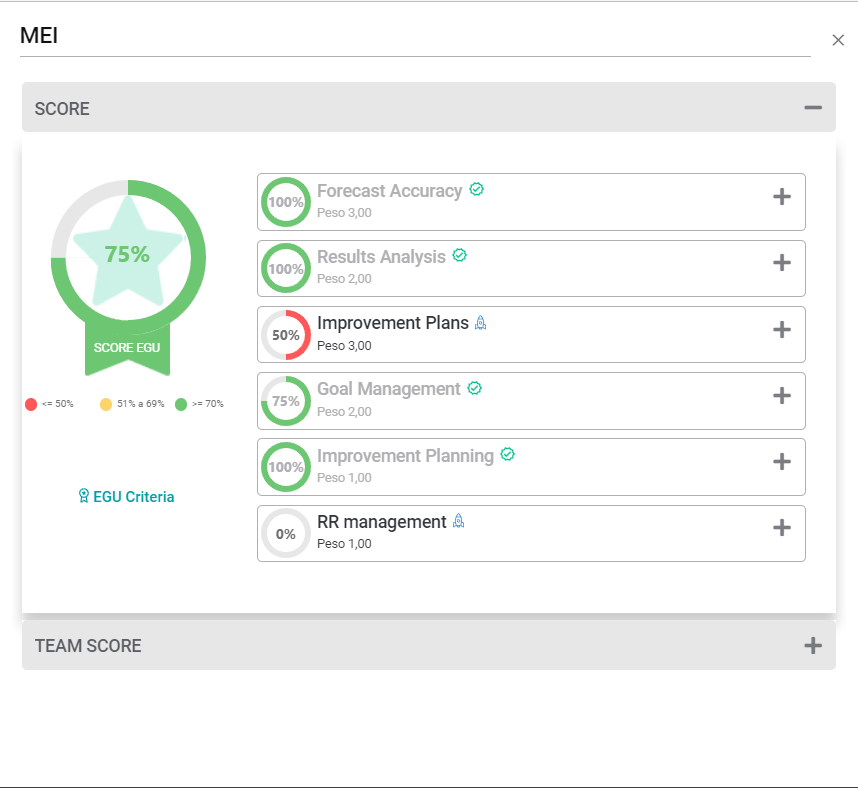
Clicking on MEI Score (EGU) as shown above, will bring you to an overview of all MEI features available.
Creating KPIs
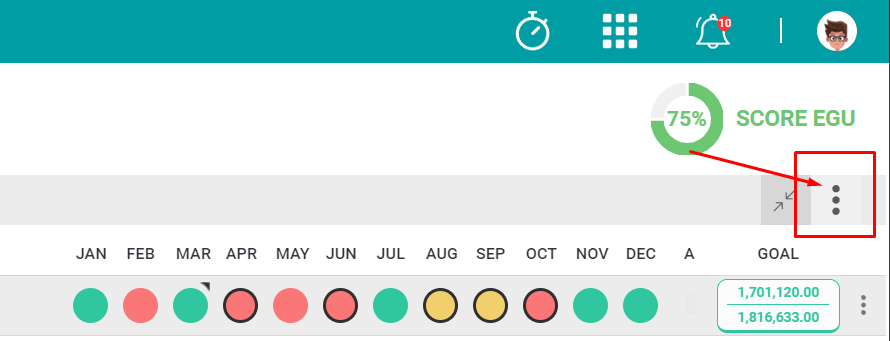
Compact view mode:
On this icon you will be able to configure the way your dashboard is displayed. Click on this icon to change to Compact Mode.
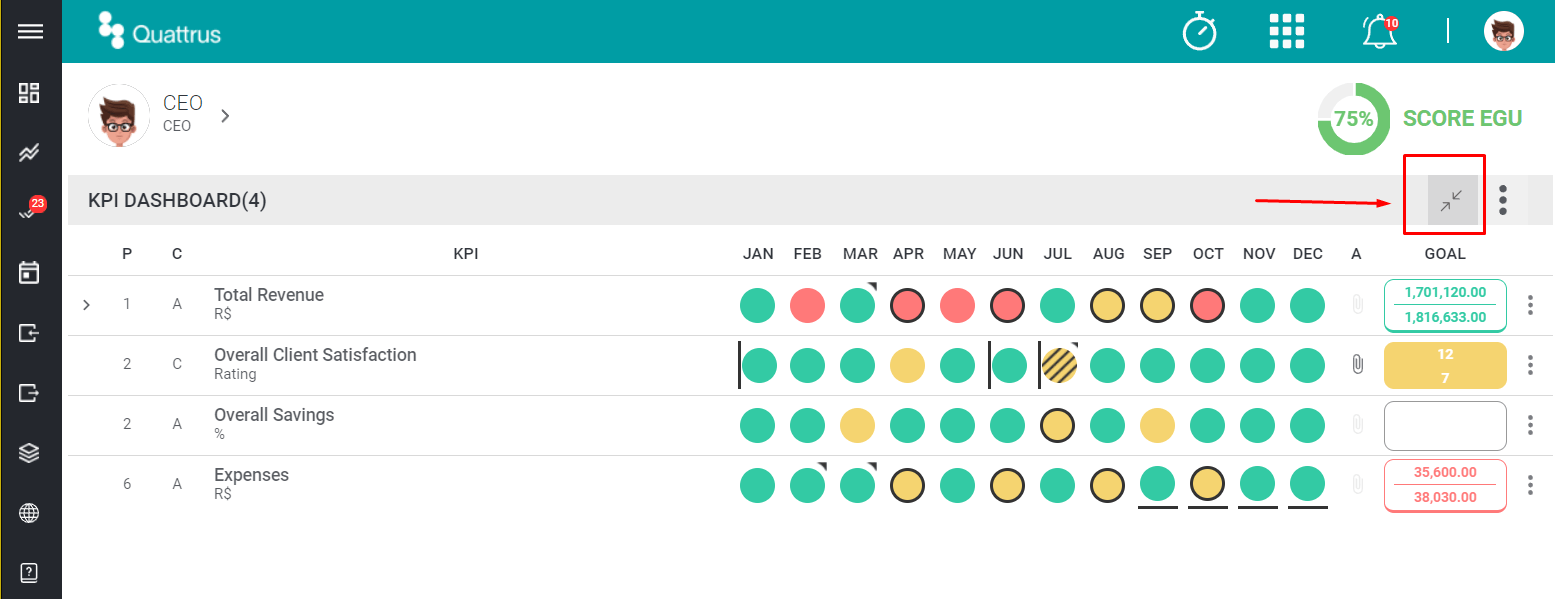
While on compact view mode, you will see the current month headlight and each of the KPIs goals. You can also view the main actions, making it more dynamic to track each task.
Click on the same button and it will be reversed to standard view mode.
More Options
By clicking on this icon you will see the functionalities in the context of the Dashboard.
Here you can Add KPIs, Delegate KPIs, Copy and Move KPIs or Restore KPIs.

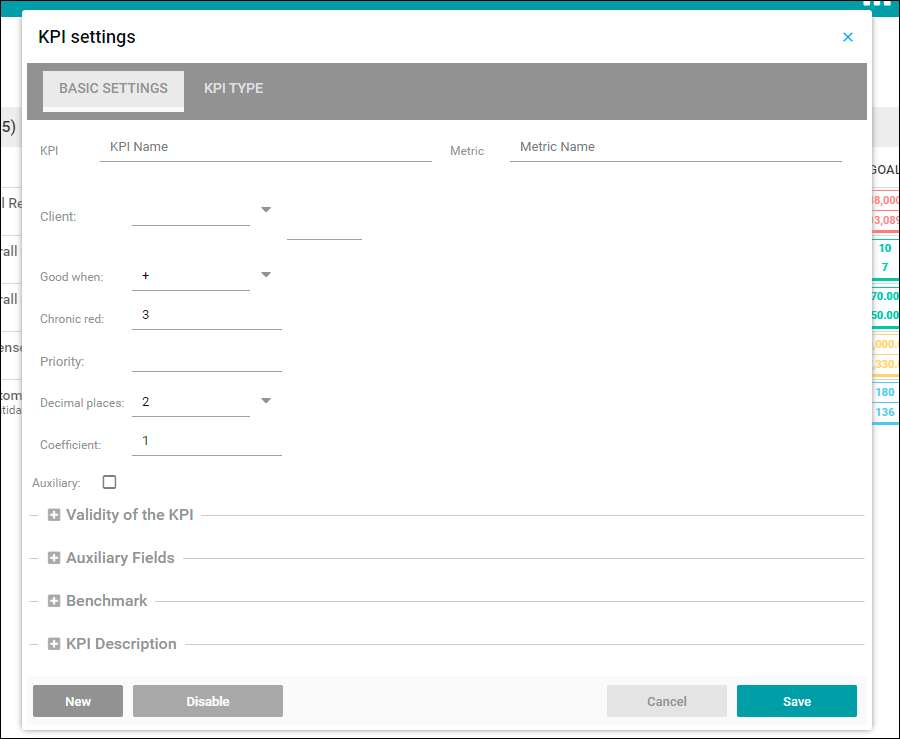
Adding KPIs
Here you can add and configure your KPIs.
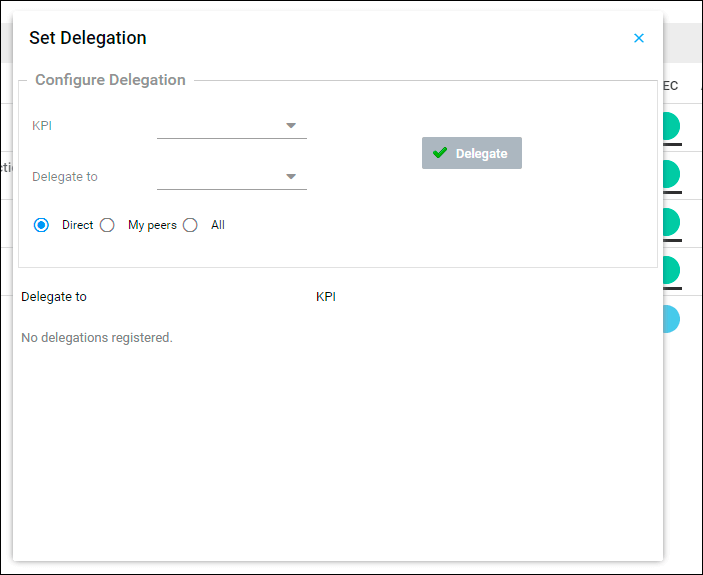
Delegating KPIs
Here you can delegate one of your KPIs to another user. That user and you will be able to make changes to it. Keep in mind that any changes one makes will appear for both.
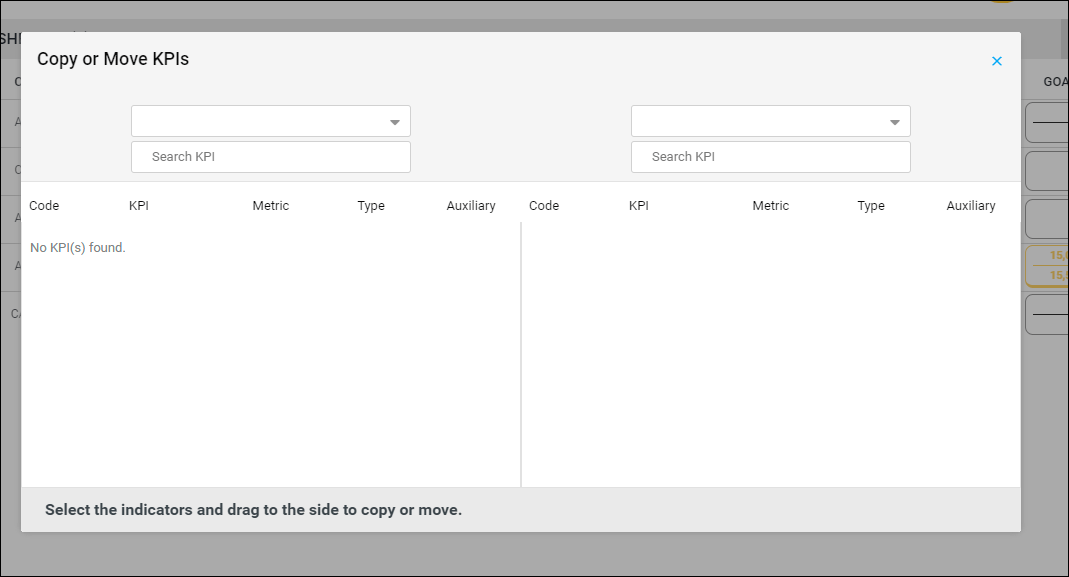
Copying and Moving KPIs
The Copy or Move KPIs feature helps you to easily transfer KPIs between users.
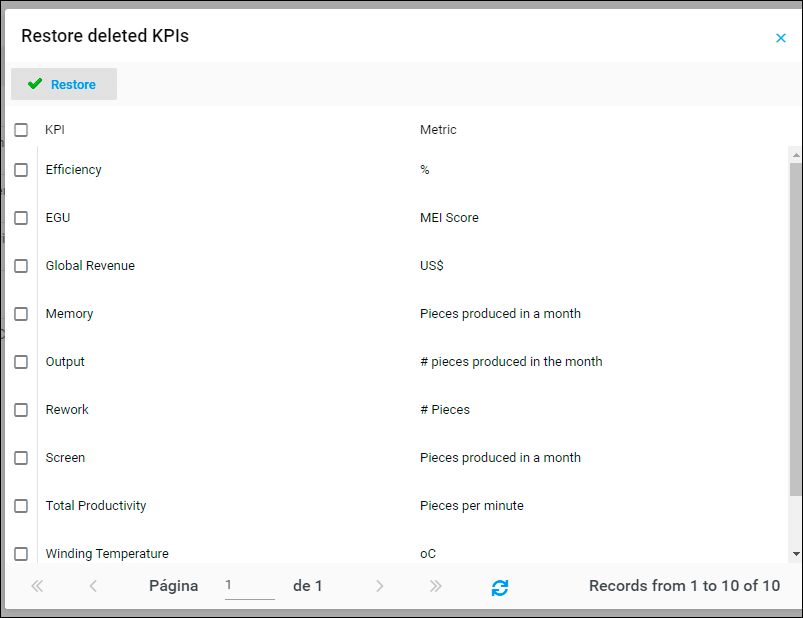
Restore KPIs
When deleting a KPI you don’t use anymore, it is disabled instead. This way you will be able to restore it and won’t lose old data.
Understanding the Columns
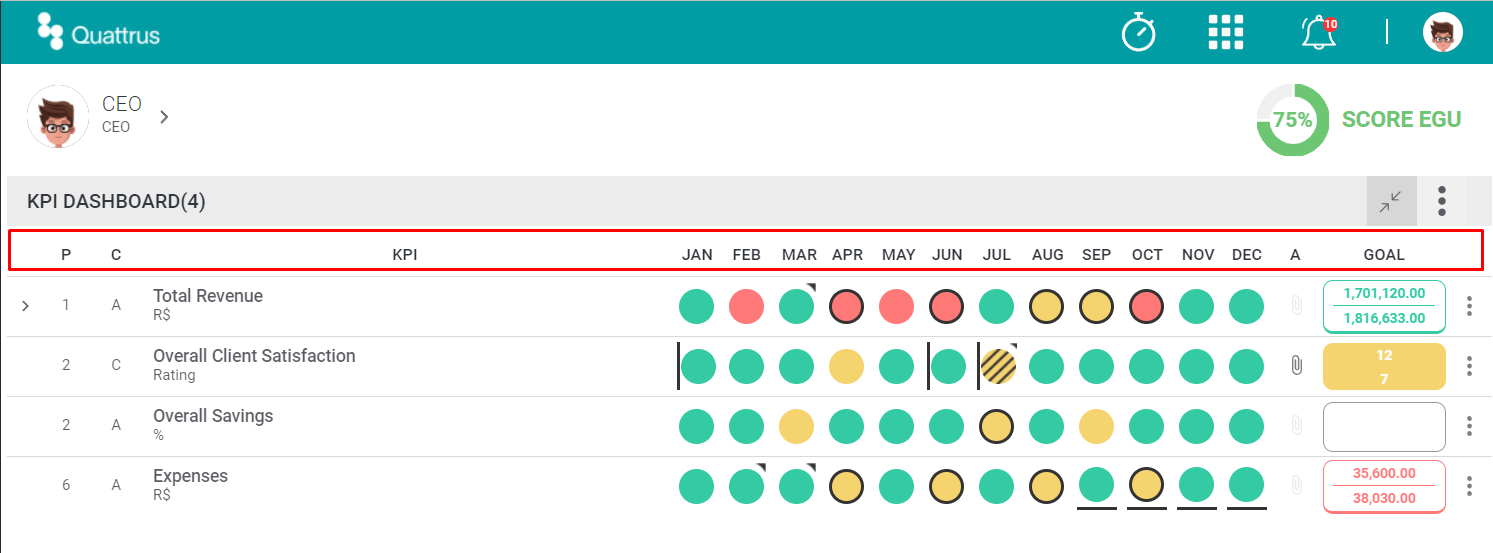
1. S/P: It refers to the client’s SECT and the KPI priority;
2. D: Indicates if the KPI is supported, linked or consolidated;
3. KPI: shows the KPI name and its unit of measurement;
4. Months: It shows the performance of each KPI, comparing the actual value to the forecast each month;
5. A (attachment): If you have a file attached to the KPI, the system will show a paper clip icon to indicate that;
6. Goal: Represents the planned goal of each KPI.
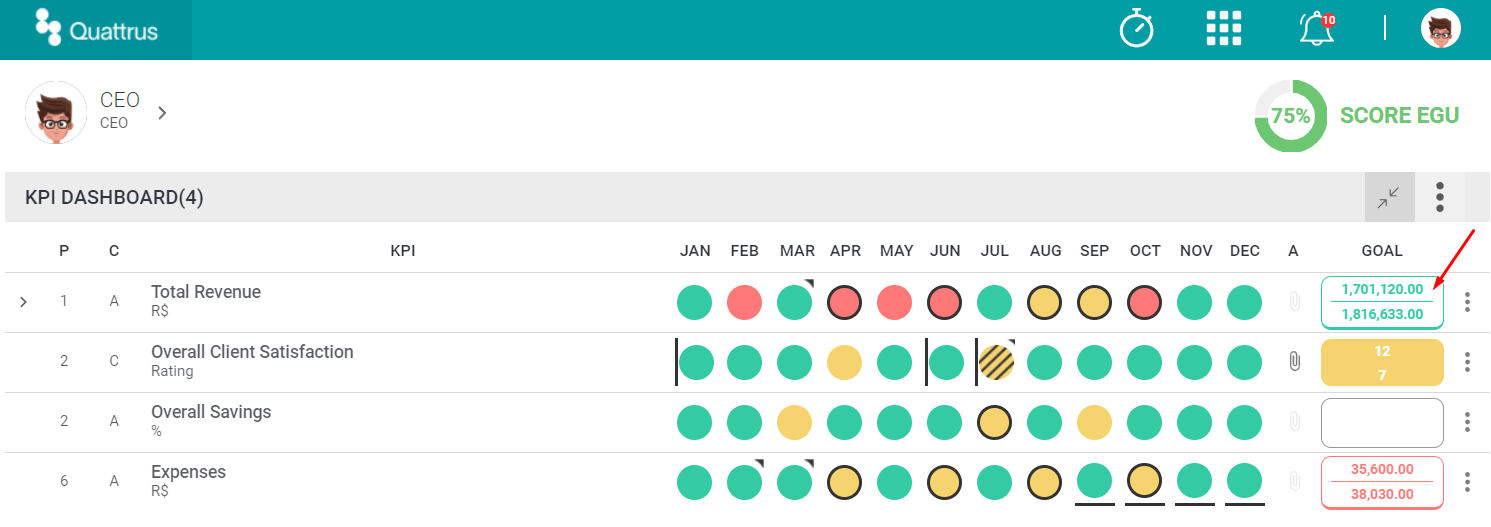
Goal Approval
This icon shows the goal approval status. This feature allows you to formalize the goals of each KPI on your team.
More Options
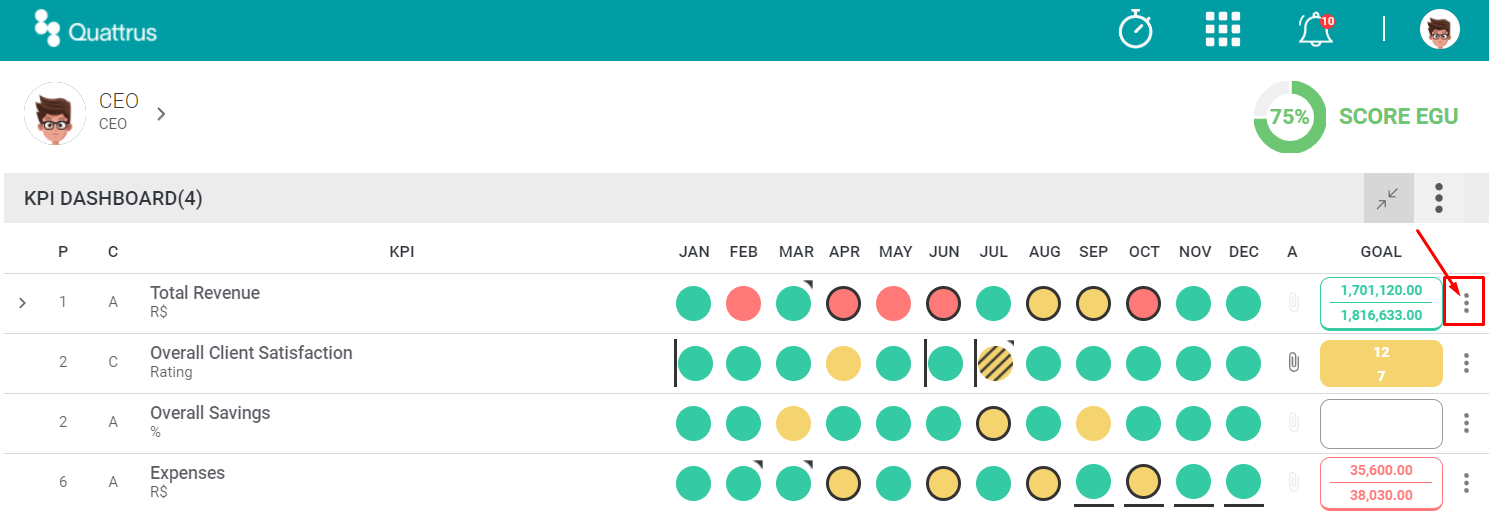
By clicking on this icon as indicated on the image above, you will see other options in context to each KPI.

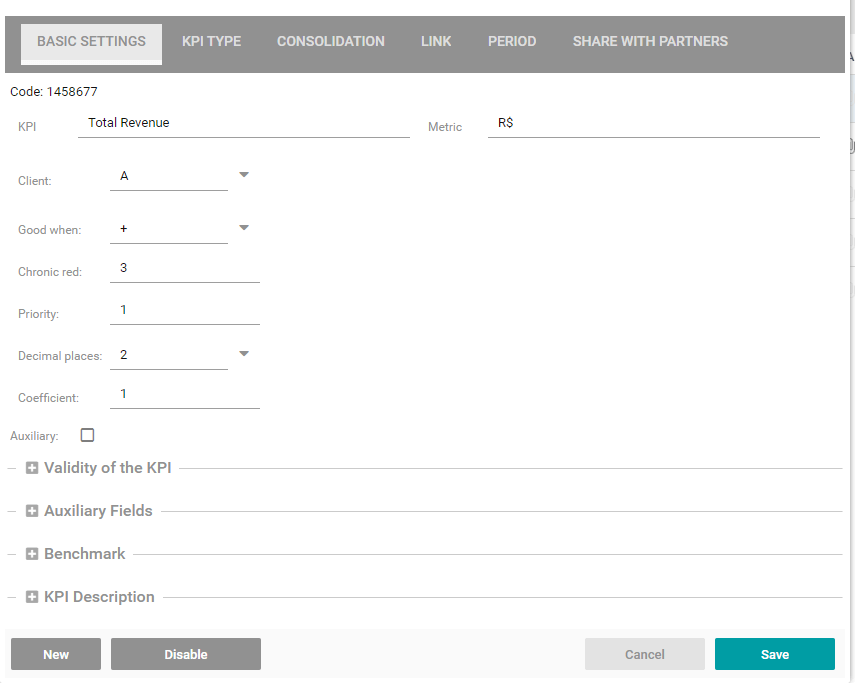
Edit KPI
This option allows you to edit the information of the selected KPI.
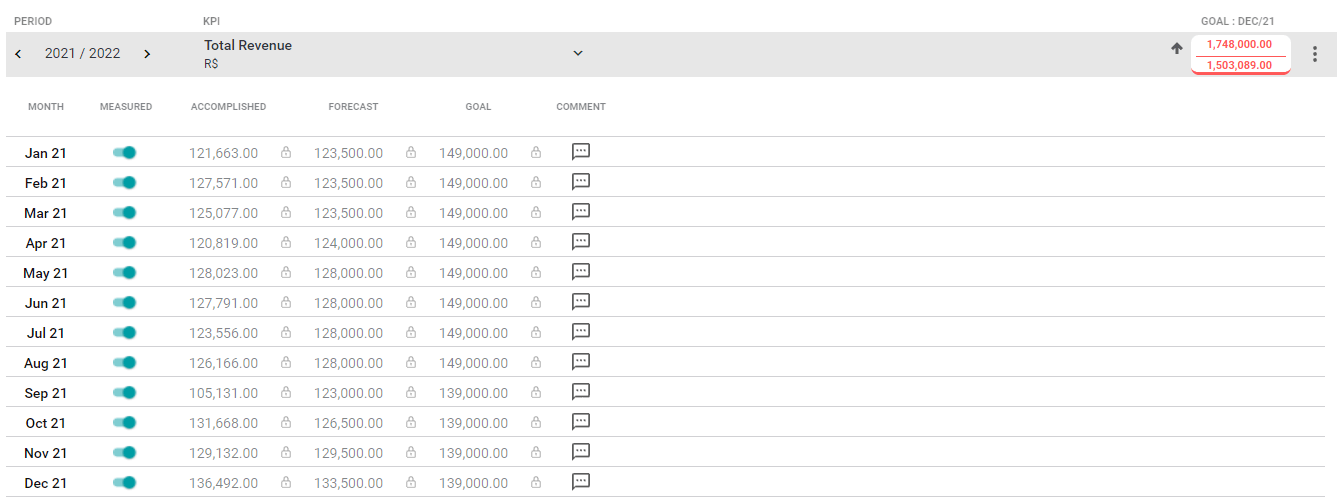
Measurements
Here you will be able to insert the Accomplished, Forecast and Budget (goal) values for your KPIs.
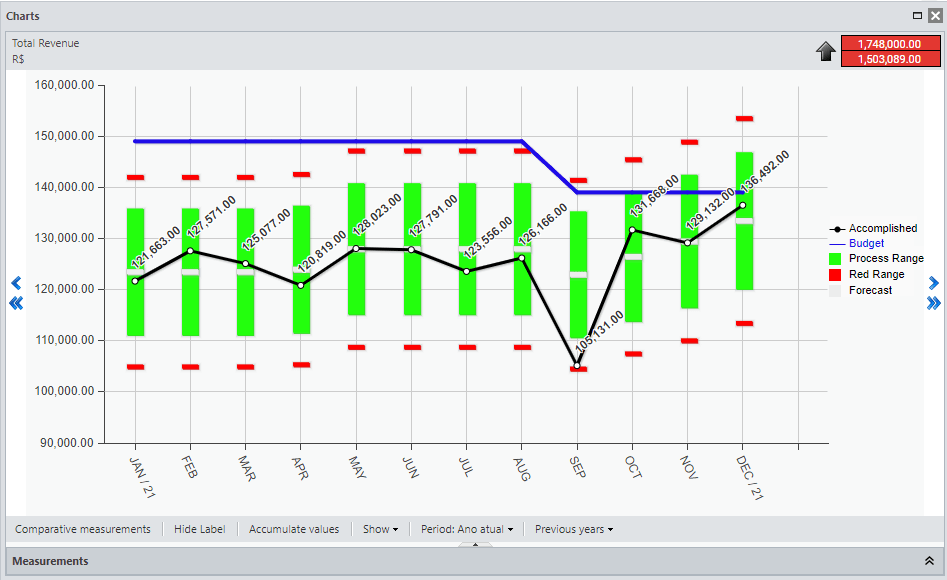
KPI Chart
By using the KPI chart you can track the performance of your KPIs.
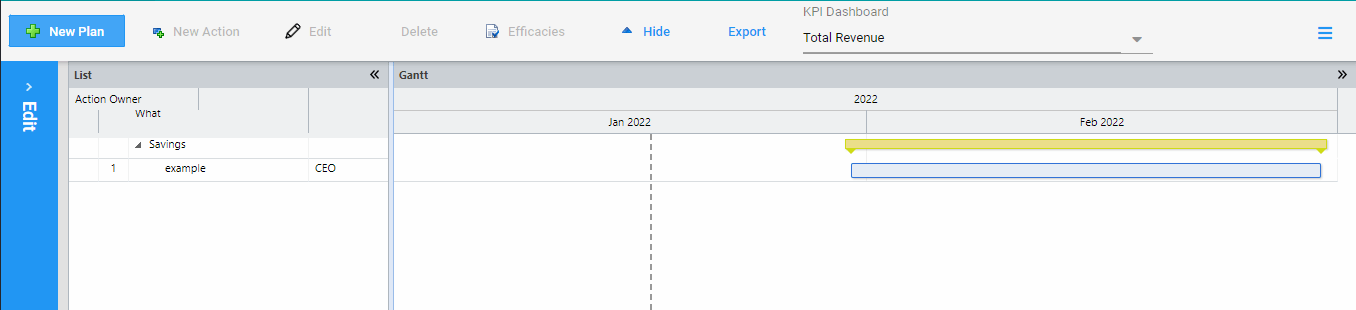
Action Plan
With the Action Plan you can create a detailed plan to achieve a goal.
KPI Attachments
Here you can add files to your KPIs or view all attached files.

Below we will see all Headlight features. Clicking on a headlight will give you access to a few options for each month.
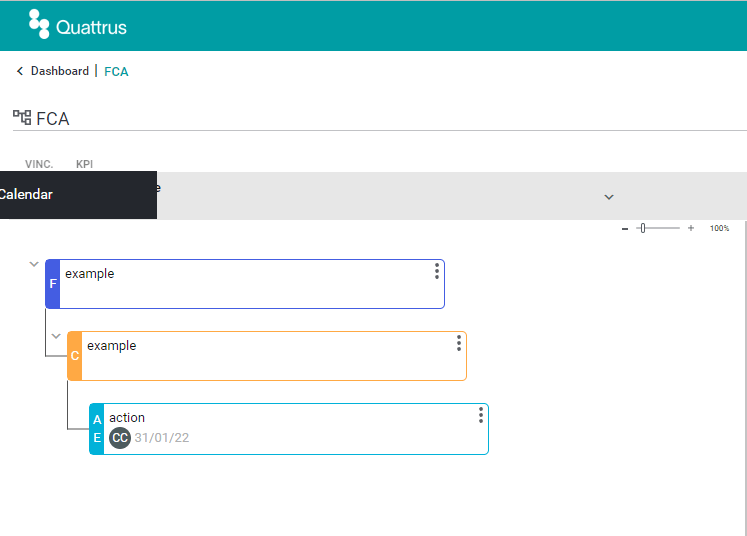
On FCA you can analyze the results of that month.
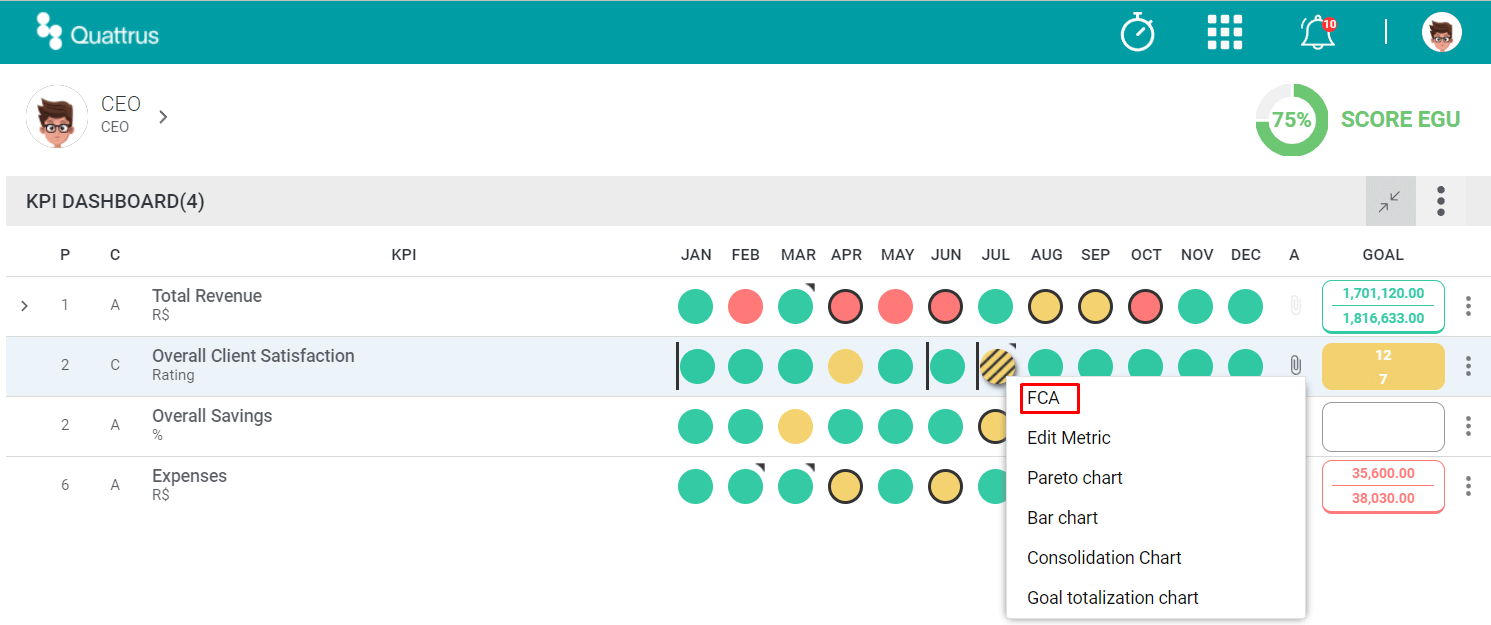
Clicking on one of the letters (FCA) will create a new field related to that respective letter to insert information.
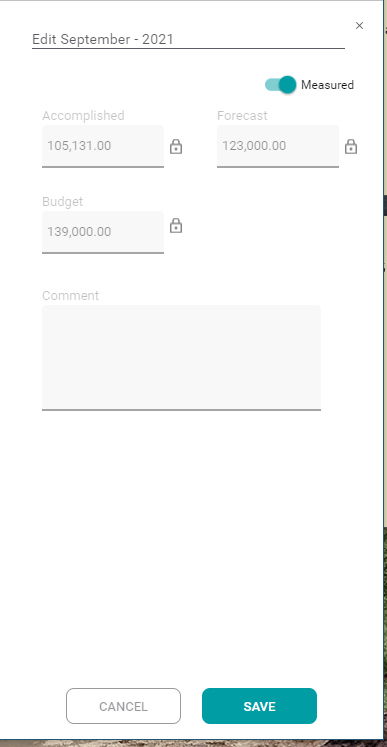
On Edit Metrics you can edit the selected month headlight by using Quick Edit.

Clicking on Edit Metrics will open the card below.
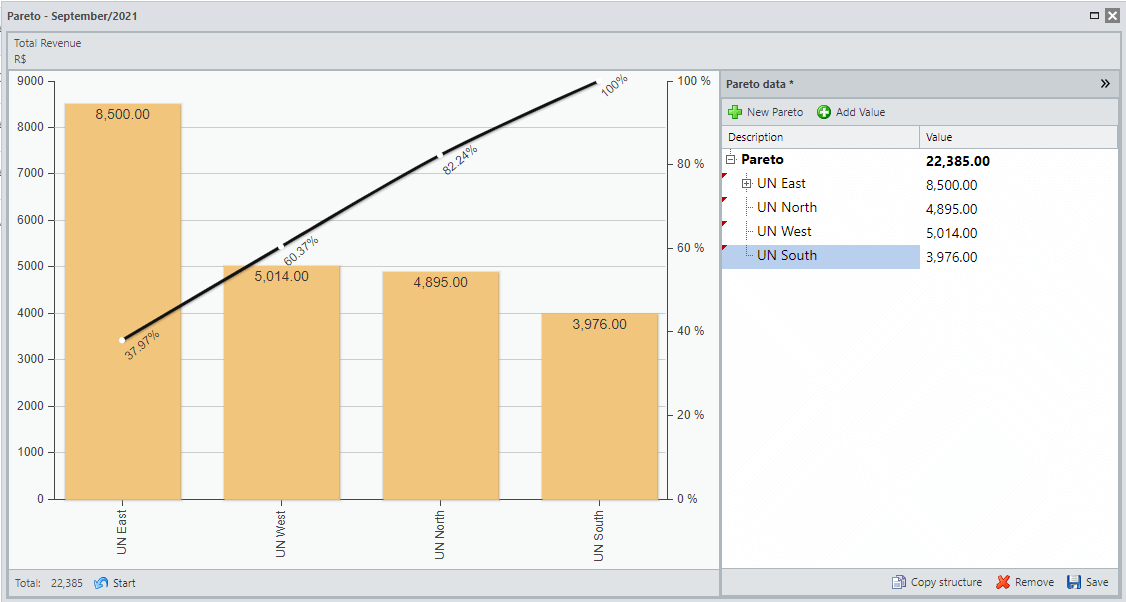
When accessing the option Pareto Chart you will be able to insert or view the chart for this month.
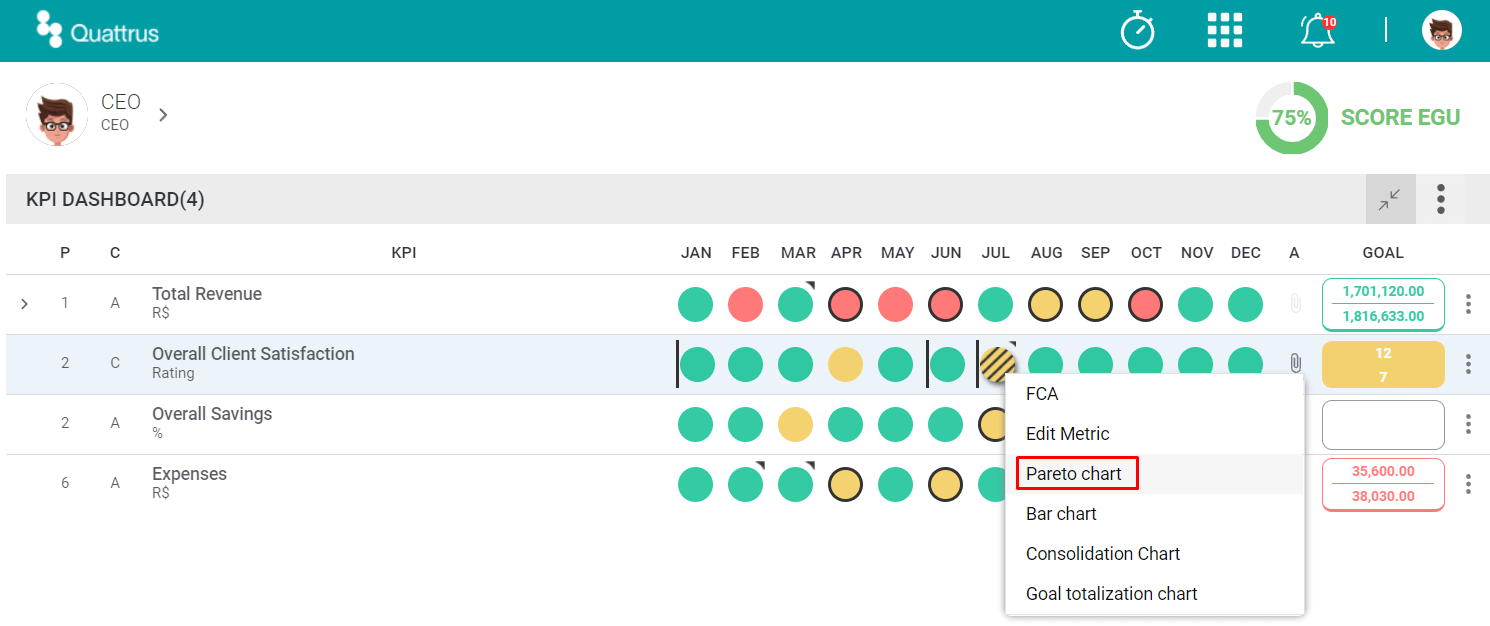
You can create and edit your Pareto chart using the table below.
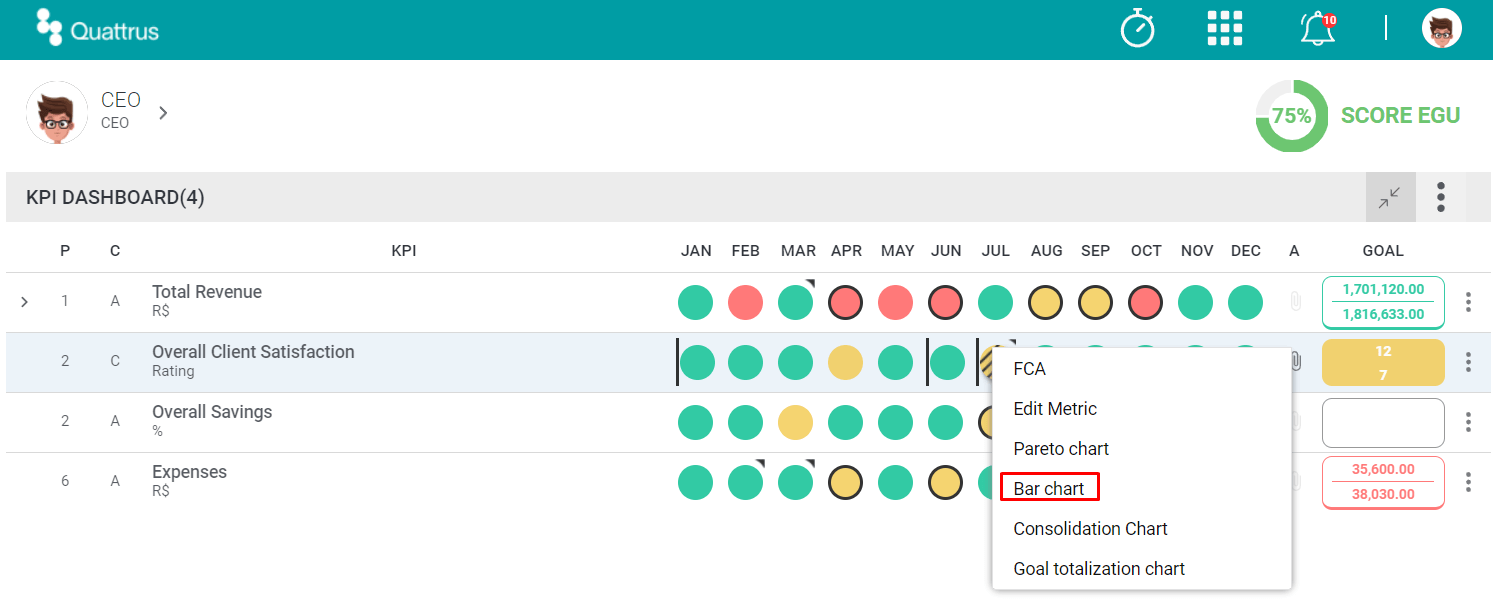
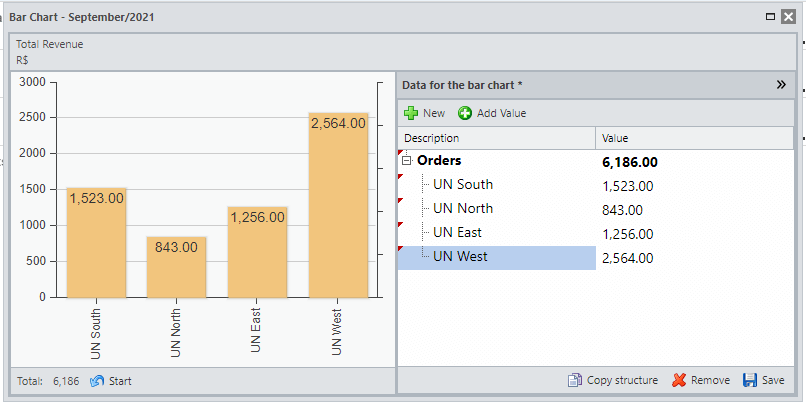
Here you can insert or view the Bar Chart of this KPI on the selected month.
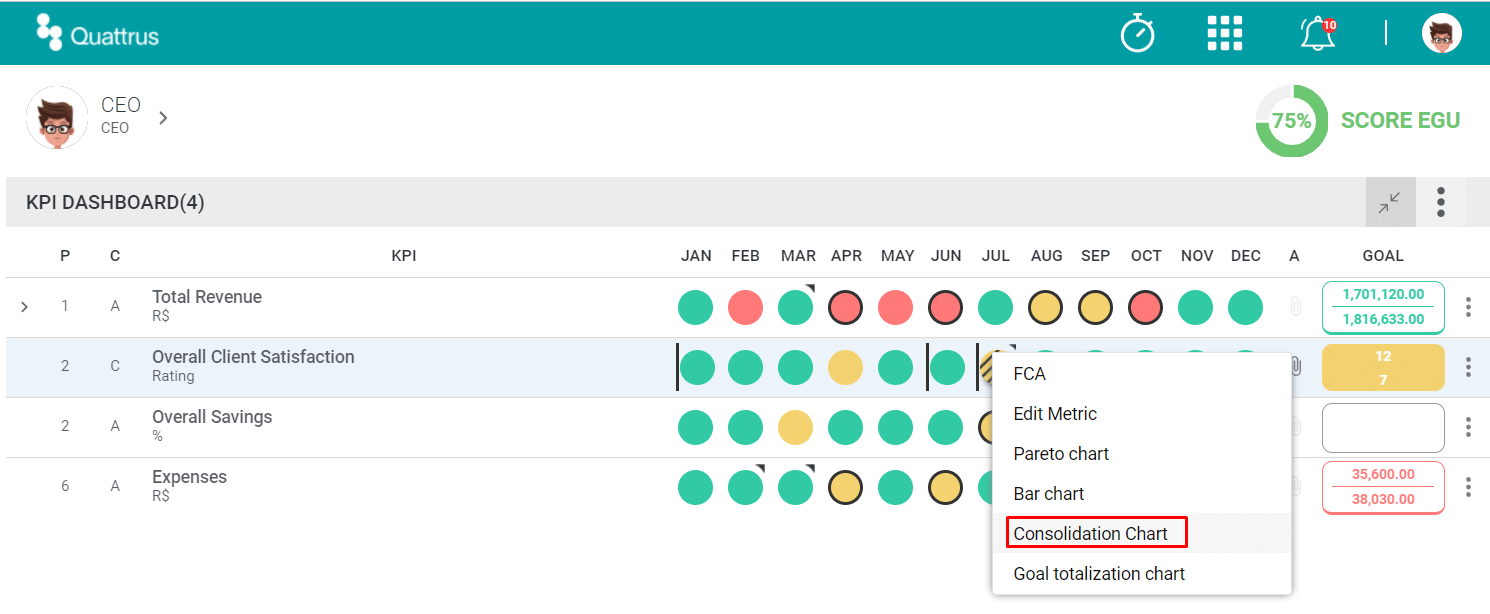
If your KPI is Consolidated, you will be able to consult the Consolidation Chart of the KPI on the selected month.

If your KPI is Consolidated, you will also be able to consult the Goal Consolidation Chart of the month.


Clicking on the three bars icon, as shown on the image above, will expand the sidebar menu. Here you can find Quattrus general features.

Below you can find an index explaining about each category found on the Sidebar Menu:
- Dashboard: alternate Dashboard view between KPIs, Auxiliary KPIs, Delegated KPIs or Subordinate’s Reds according to your configuration;
- Multigraphs: the multigraphs option allows you to configure and view several charts simultaneously;
- Approvals: this feature gives you the option to approve Goals and Forecasts;
- Calendar: here you can see appointments and updates regarding your meetings;
- Import: on this category you can import data such as KPIs, Metrics, Charts and Users;
- Export: here you have the option to export data such as KPI list, Metrics and Results Meeting Report;
- Tasks: you can create tasks using the 5W2H format whenever you need;
- Language: here you can choose the language of your preference: Portuguese, English or Spanish;
- Help: on Help you will access a screen containing helpful information about Headlights and Goals.