[et_pb_section fb_built=”1″ _builder_version=”4.4.8″][et_pb_row column_structure=”1_5,3_5,1_5″ module_class=” et_pb_row_fullwidth” _builder_version=”3.25″ width=”89%” width_tablet=”80%” width_phone=”” width_last_edited=”on|desktop” max_width=”89%” max_width_tablet=”80%” max_width_phone=”” max_width_last_edited=”on|desktop” make_fullwidth=”on”][et_pb_column type=”1_5″ _builder_version=”3.25″ custom_padding=”|||” custom_padding__hover=”|||”][et_pb_text disabled_on=”on|on|” admin_label=”Iniciantes – Navegação vertical” _builder_version=”4.9.1″ max_width=”100%” saved_tabs=”all”]
[/et_pb_text][et_pb_text disabled_on=”on|on|” admin_label=”Artigos Relacionados” _builder_version=”4.9.2″ text_font=”|600|||||||” text_text_color=”#727272″ header_line_height=”1.1em” header_2_font=”|800||||on|||” header_2_text_align=”left” header_2_text_color=”#494949″ header_3_font=”|600|||||||” header_3_text_color=”#494949″ header_3_font_size=”14px” header_3_line_height=”1.2em” module_alignment=”left” z_index_tablet=”500″ text_text_shadow_horizontal_length_tablet=”0px” text_text_shadow_vertical_length_tablet=”0px” text_text_shadow_blur_strength_tablet=”1px” link_text_shadow_horizontal_length_tablet=”0px” link_text_shadow_vertical_length_tablet=”0px” link_text_shadow_blur_strength_tablet=”1px” ul_text_shadow_horizontal_length_tablet=”0px” ul_text_shadow_vertical_length_tablet=”0px” ul_text_shadow_blur_strength_tablet=”1px” ol_text_shadow_horizontal_length_tablet=”0px” ol_text_shadow_vertical_length_tablet=”0px” ol_text_shadow_blur_strength_tablet=”1px” quote_text_shadow_horizontal_length_tablet=”0px” quote_text_shadow_vertical_length_tablet=”0px” quote_text_shadow_blur_strength_tablet=”1px” header_text_shadow_horizontal_length_tablet=”0px” header_text_shadow_vertical_length_tablet=”0px” header_text_shadow_blur_strength_tablet=”1px” header_2_text_shadow_horizontal_length_tablet=”0px” header_2_text_shadow_vertical_length_tablet=”0px” header_2_text_shadow_blur_strength_tablet=”1px” header_3_text_shadow_horizontal_length_tablet=”0px” header_3_text_shadow_vertical_length_tablet=”0px” header_3_text_shadow_blur_strength_tablet=”1px” header_4_text_shadow_horizontal_length_tablet=”0px” header_4_text_shadow_vertical_length_tablet=”0px” header_4_text_shadow_blur_strength_tablet=”1px” header_5_text_shadow_horizontal_length_tablet=”0px” header_5_text_shadow_vertical_length_tablet=”0px” header_5_text_shadow_blur_strength_tablet=”1px” header_6_text_shadow_horizontal_length_tablet=”0px” header_6_text_shadow_vertical_length_tablet=”0px” header_6_text_shadow_blur_strength_tablet=”1px” box_shadow_horizontal_tablet=”0px” box_shadow_vertical_tablet=”0px” box_shadow_blur_tablet=”40px” box_shadow_spread_tablet=”0px” saved_tabs=”all”]
Related posts
[/et_pb_text][/et_pb_column][et_pb_column type=”3_5″ _builder_version=”3.25″ custom_padding=”|||” custom_padding__hover=”|||”][et_pb_post_title meta=”off” featured_image=”off” _builder_version=”3.17.6″ title_font=”|700||||on|||” title_font_size=”36px”]
[/et_pb_post_title][et_pb_tabs _builder_version=”4.9.1″][et_pb_tab title=”Home Dashboard” _builder_version=”4.9.1″]
 t the top you will find the following information:

When clicking on the ICG button, the system will return to the initial dashboard. Next to it is the icon for more advanced options.
In the center of the upper part, you will find the EGU Score bar, which allows you to track your EGU score in real time.
In the right corner, you will see a flag where you can change the language of the ICG. The company information and the name of the user responsible for the ICG table are attached to the side.
Observation:
When a manager clicks to view another user’s ICG, the company and user information will appear as follows:

Finally, we have the gear icon, where you can check more information about the logged in user, access the settings and log out.
Just below, you will see the ICG icons. We will see in the next steps what each one means.

At the bottom you can view the version of the ICG, and in the right corner you can click to access the Support’s Portal.

[/et_pb_tab][et_pb_tab title=”Understanding the Tabs” _builder_version=”4.9.1″]
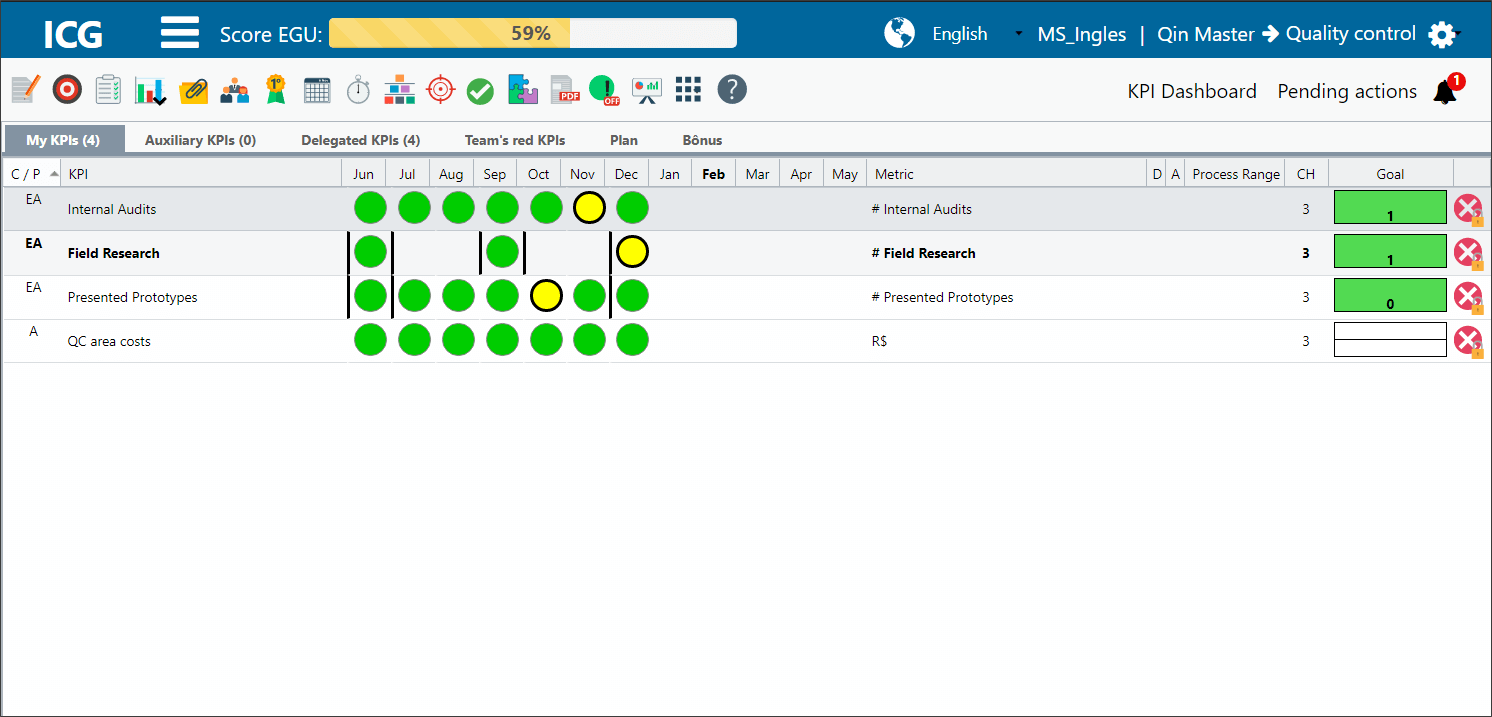
In this tab are located the main KPIs. You will need to manage these items.

In this tab are located the Auxiliary KPIs, that is, items that do not need management, but that support the analysis and monitoring of the main items.

KPIs that are delegated from my leader / manager to me. When the user completes the measurements, action plan and FCA, it will automatically appear to the leader / manager.

When a subordinate’s KPI has the red beacon of the month or the red Customer Band, the item will appear in this tab so that the leader / manager can follow up.

- Totalized KPIs and Linked KPIs
When column D is marked with a gray stripe, it means that the KPI is linked or totaled.
To learn more, visit the Item Summing and KPI Linking article.

Entendendo as Colunas

1. Owner: Indicates the user that the item belongs to.
2. C/P: Referring to Customer C.E.V.A. and the priority of the items.
To learn more, visit the article C.E.V.A.
3. KPIs: Names of the items.
4. Months: Represent the performance of each item by comparing what has been done with the forecast for each month.
5. Metric: Represents the unit of measurement for each item.
6. D: Indication if the KPI is unfolded, linked or totaled.
7. A: If you have an attachment to the item, clips will appear.
8. Green Band: Forecast for each KPI.
9. CH: Chronic red.
To learn more, visit the article What is chronic red?
10. Goal: Represents the expected goal for each control item.
[/et_pb_tab][et_pb_tab title=”Plan and FCA Tabs” _builder_version=”4.9.1″]
In this tab it will be possible to register or consult an Action Plan.
We will see more about the Action Plan in the next steps.

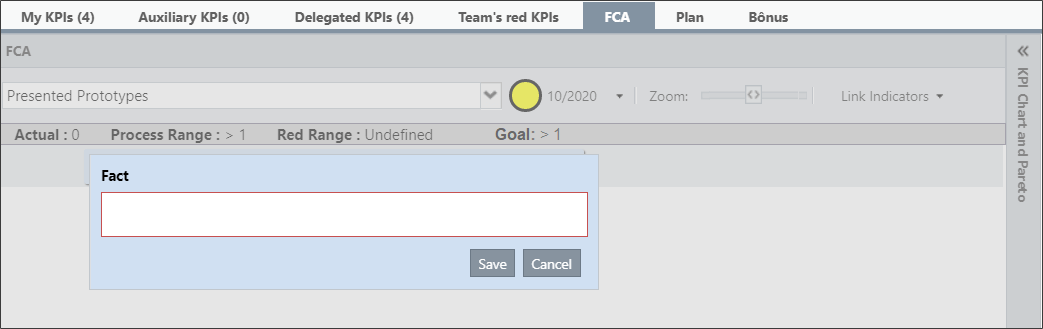
- FCA (Fact – Cause – Action)
When a result for the month has gone out of range (beacon is not green), a black border will appear around the beacon. When you click on this beacon, the FCA option will appear available.
In this tab you will analyze the causes for your result to be out of the expected. We will see more about this tab in the next steps.
[/et_pb_tab][/et_pb_tabs][/et_pb_column][et_pb_column type=”1_5″ _builder_version=”3.25″ custom_padding=”|||” custom_padding__hover=”|||”][et_pb_image src=”https://suporte.quattrus.com/wp-content/uploads/2021/03/Artboard-2-copy-5.jpg” title_text=”Artboard 2 copy 5″ align_tablet=”center” align_phone=”” align_last_edited=”on|desktop” disabled_on=”on|on|” admin_label=”ESP – Banner – Contato Suporte” _builder_version=”4.9.2″ z_index=”0″ always_center_on_mobile=”on” saved_tabs=”all” locked=”off”][/et_pb_image][et_pb_image src=”https://suporte.quattrus.com/wp-content/uploads/2021/03/Prancheta-1.jpg” title_text=”Prancheta 1″ url=”https://www.qualitin.com.br/consultoria/” url_new_window=”on” align_tablet=”center” align_phone=”” align_last_edited=”on|desktop” disabled_on=”on|on|” admin_label=”Banner – Consultoria” _builder_version=”4.9.2″ max_width=”100%” saved_tabs=”all”][/et_pb_image][/et_pb_column][/et_pb_row][/et_pb_section]


 Português
 Español