

 Português
 Español
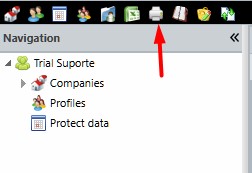
To access the multi-graphs report, go to the system’s admin panel and click on the icon indicated below:
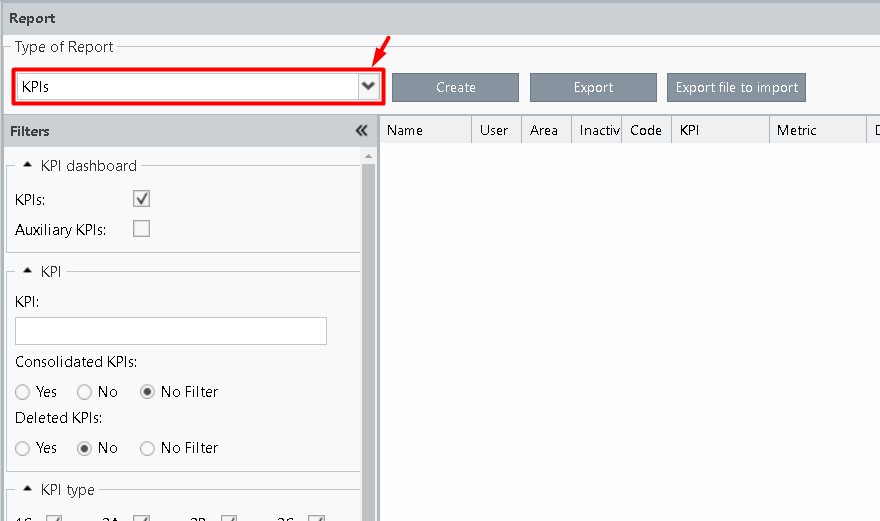
You will see the following screen, select the report type in the dropdown box below:
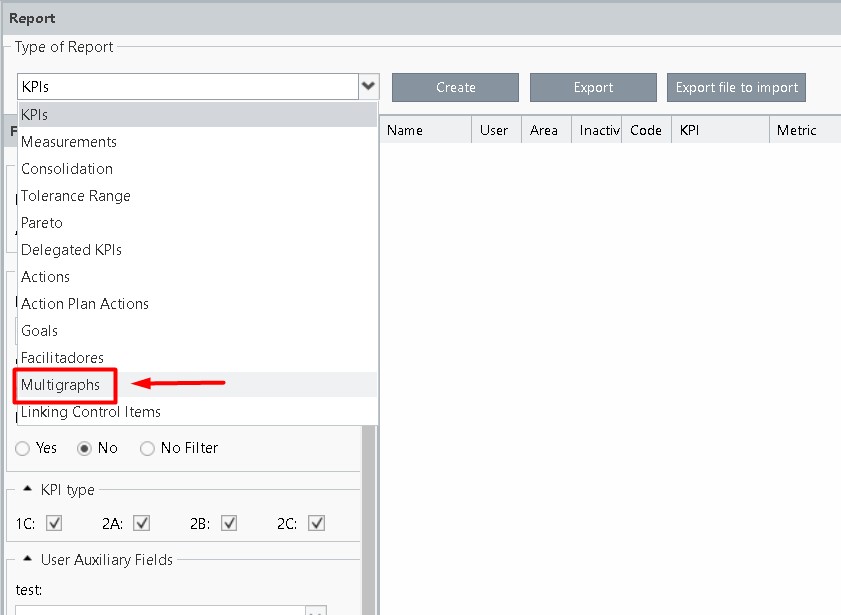
Select the Multi-graphs option, set the filters, and click generate or export:
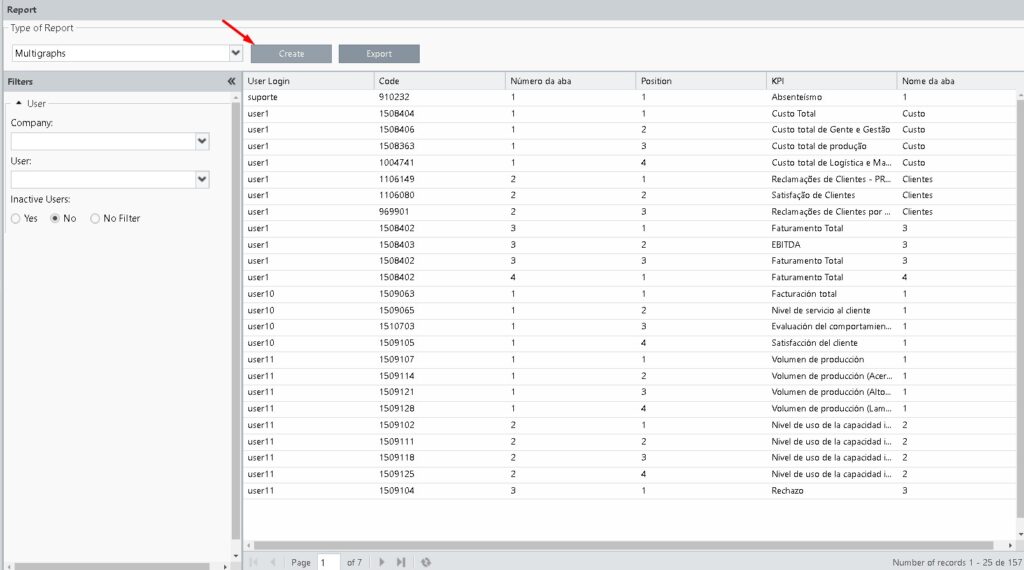
Filters:
- Company: Choose the company to be listed in the report.
- User: Select the name of the user you want to view in the report.
- Inactive Users: Yes determines that inactive users will be listed, No determines that they should not appear in the report. No filter will show both.
Buttons:
- Generate: Generates the report on the screen as shown in the image above.
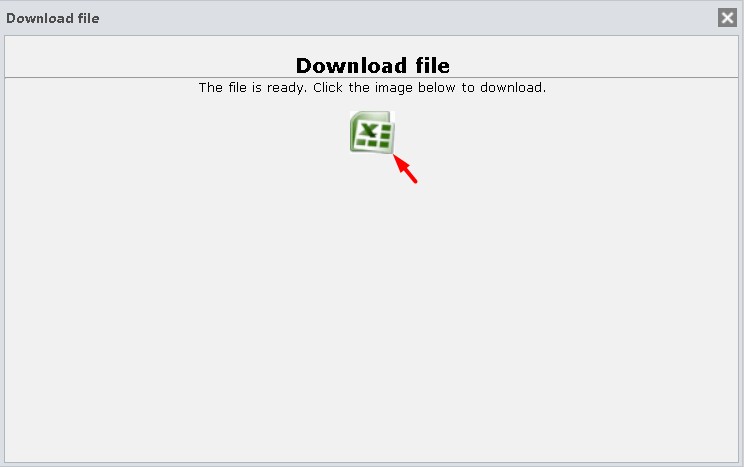
- Export: Exports a file in Excel format (.xlsx). After clicking Export, a popup will appear with an Excel icon. Click the icon to start the download.
IMPORTANT:
The exported file will use the same columns as the import mask, making it possible to modify the file and then import it using the same columns.