

 Português
When accessing the measurements of a KPI, you will see the following image:
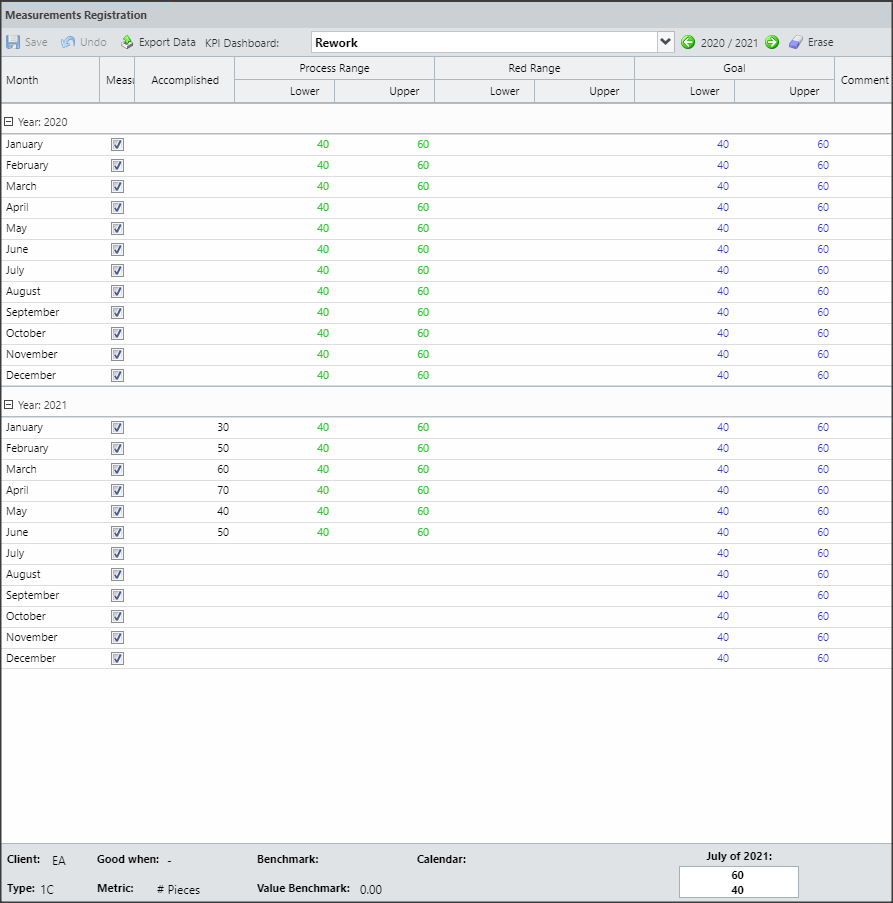
At the bottom, you will see the following KPI information:

- Which client does he serve
- What type of KPI
- If it’s good for more, less or equal
- What is the KPI metricr
- If there is a Benchmark, the name and value will appear
- If the KPI is on a Protection Calendar, the name of the calendar appears
- It will show the Customer Band and above it will be indicated which month is related to this band
At the top you will have some options of buttons to facilitate the navigation and visualization of the measurements:

- Save: Save your changes.
- Undo: In case you enter an incorrect value and want to return to the previous measurement, you can use this button.
- Export Measurements: Export the measurements of this KPI to an excel file.
- KPI: Navigate between your KPIs. Therefore, it is not necessary to return to the initial dashboard to view the measurement of another KPI.
- Date: You can move forward or backward through the years, viewing future or past measurements. Remembering that it will always show two years on the measurement screen.
- Delete: If you want to delete a measurement, you can use this button.
Important: In KPIs of type 1C, the user must register the bands according to the “good for”, if the KPI is “good for less”, the user must register the upper green band as mandatory, if the item is “good for more”, the user must register the lower green band as mandatory. This is used for the ICG to colorize the KPI’s goal color.
To find out how to register measurements, access the Measurements: Insert values.