Português
 Español
When there is a light with an arrow, as below, it means that there is a Pareto or bar chart for that month.
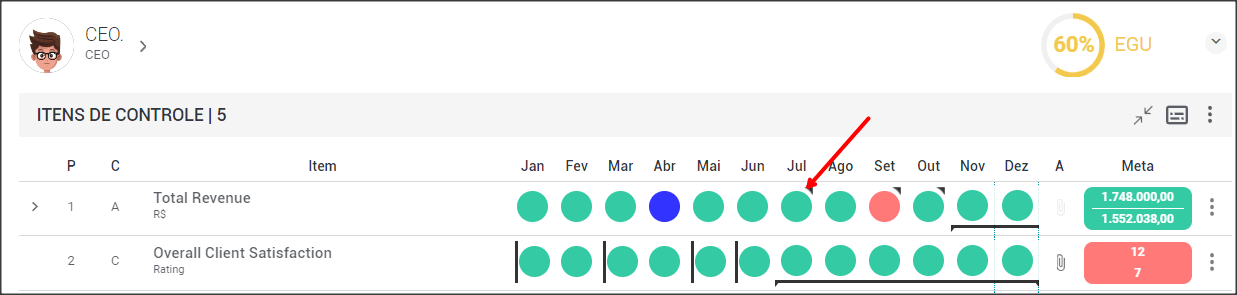
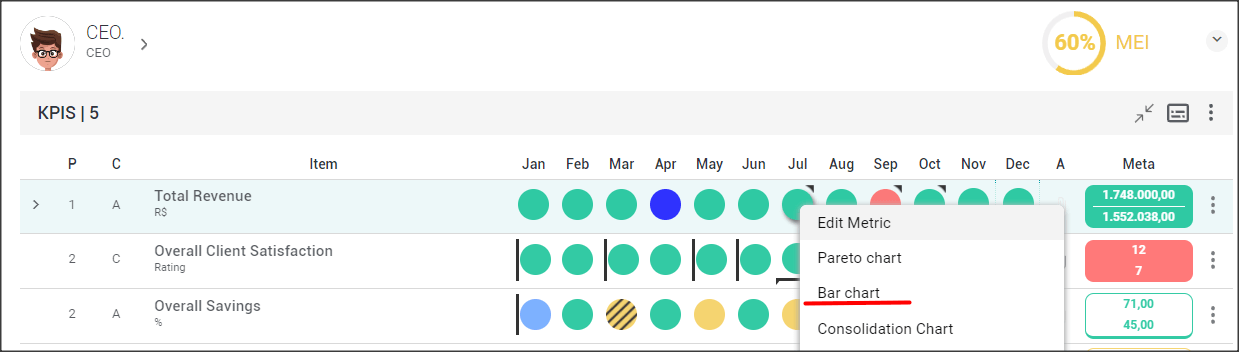
Select the month you want, click on the light and select the Bar Graph option.
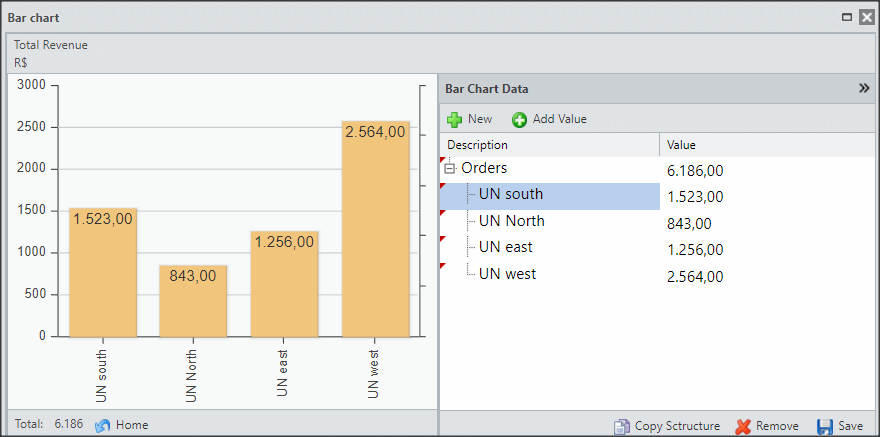
You will see the Bar Chart. To view the structure, click on Bar Chart Data.

This way you can see the structure of the Bar Chart.