[et_pb_section fb_built=”1″ _builder_version=”4.4.8″][et_pb_row column_structure=”1_5,3_5,1_5″ module_class=” et_pb_row_fullwidth” _builder_version=”3.25″ width=”89%” width_tablet=”80%” width_phone=”” width_last_edited=”on|desktop” max_width=”89%” max_width_tablet=”80%” max_width_phone=”” max_width_last_edited=”on|desktop” make_fullwidth=”on”][et_pb_column type=”1_5″ _builder_version=”3.25″ custom_padding=”|||” custom_padding__hover=”|||”][et_pb_text disabled_on=”on|on|” admin_label=”Itens Usuário – Navegação vertical” _builder_version=”4.9.2″ max_width=”100%” z_index_tablet=”500″ saved_tabs=”all” locked=”off”]
[/et_pb_text][et_pb_text disabled_on=”on|on|” admin_label=”Artigos Relacionados” _builder_version=”4.9.2″ text_font=”|600|||||||” text_text_color=”#727272″ header_line_height=”1.1em” header_2_font=”|800||||on|||” header_2_text_align=”left” header_2_text_color=”#494949″ header_3_font=”|600|||||||” header_3_text_color=”#494949″ header_3_font_size=”14px” header_3_line_height=”1.2em” module_alignment=”left” z_index_tablet=”500″ text_text_shadow_horizontal_length_tablet=”0px” text_text_shadow_vertical_length_tablet=”0px” text_text_shadow_blur_strength_tablet=”1px” link_text_shadow_horizontal_length_tablet=”0px” link_text_shadow_vertical_length_tablet=”0px” link_text_shadow_blur_strength_tablet=”1px” ul_text_shadow_horizontal_length_tablet=”0px” ul_text_shadow_vertical_length_tablet=”0px” ul_text_shadow_blur_strength_tablet=”1px” ol_text_shadow_horizontal_length_tablet=”0px” ol_text_shadow_vertical_length_tablet=”0px” ol_text_shadow_blur_strength_tablet=”1px” quote_text_shadow_horizontal_length_tablet=”0px” quote_text_shadow_vertical_length_tablet=”0px” quote_text_shadow_blur_strength_tablet=”1px” header_text_shadow_horizontal_length_tablet=”0px” header_text_shadow_vertical_length_tablet=”0px” header_text_shadow_blur_strength_tablet=”1px” header_2_text_shadow_horizontal_length_tablet=”0px” header_2_text_shadow_vertical_length_tablet=”0px” header_2_text_shadow_blur_strength_tablet=”1px” header_3_text_shadow_horizontal_length_tablet=”0px” header_3_text_shadow_vertical_length_tablet=”0px” header_3_text_shadow_blur_strength_tablet=”1px” header_4_text_shadow_horizontal_length_tablet=”0px” header_4_text_shadow_vertical_length_tablet=”0px” header_4_text_shadow_blur_strength_tablet=”1px” header_5_text_shadow_horizontal_length_tablet=”0px” header_5_text_shadow_vertical_length_tablet=”0px” header_5_text_shadow_blur_strength_tablet=”1px” header_6_text_shadow_horizontal_length_tablet=”0px” header_6_text_shadow_vertical_length_tablet=”0px” header_6_text_shadow_blur_strength_tablet=”1px” box_shadow_horizontal_tablet=”0px” box_shadow_vertical_tablet=”0px” box_shadow_blur_tablet=”40px” box_shadow_spread_tablet=”0px” saved_tabs=”all” locked=”off”]
Related Posts
[/et_pb_text][/et_pb_column][et_pb_column type=”3_5″ _builder_version=”3.25″ custom_padding=”|||” custom_padding__hover=”|||”][et_pb_post_title meta=”off” featured_image=”off” _builder_version=”3.19.18″ title_font=”|700||||on|||” title_font_size=”36px” custom_margin=”||20px” border_width_bottom=”5px” border_color_bottom=”#0c71c3″][/et_pb_post_title][et_pb_text _builder_version=”4.9.7″ custom_margin=”||20px||false|false” custom_padding=”20px|25px||25px||true” hover_enabled=”0″ border_color_top=”#0c71c3″ sticky_enabled=”0″]
EGU Score Bar
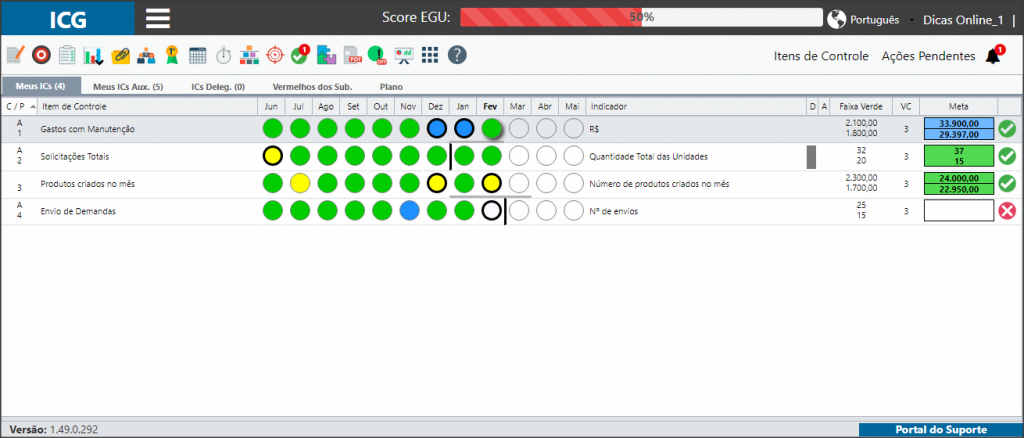
The ICG now has a score bar at the top of the ICG screen, which allows the user to monitor their score in real time as they meet EGU criteria.
Exemple
In this case, the user lacked to register one of the measurements, make an FCA and set a goal. His EGU was 50% (red).
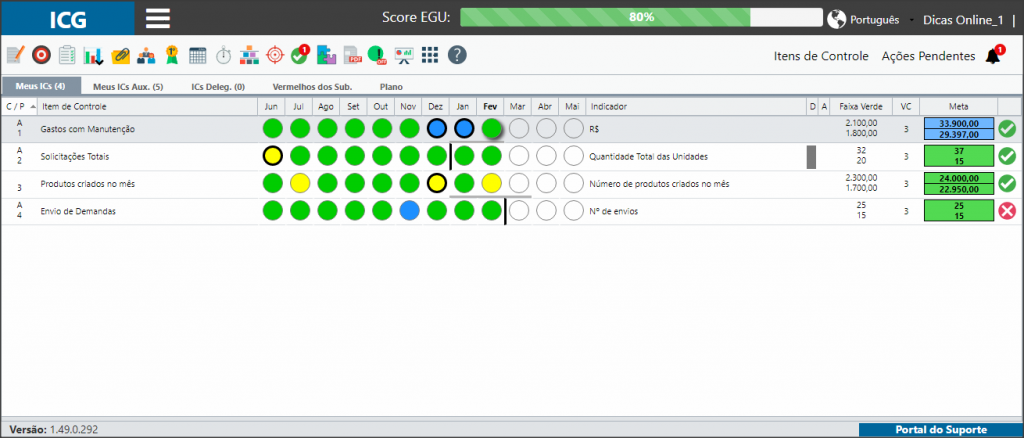
Here, the user filled in a missing measurement but continues with an FCA and the definition of a missing goal.
In this case, its EGU was 53% (yellow).

In this case, the user did the FCA and defined the missing goal.
Now your EGU is at 80% (green).
[/et_pb_text][et_pb_text _builder_version=”4.9.7″ custom_margin=”||20px||false|false” custom_padding=”20px|25px||25px||true” hover_enabled=”0″ border_color_top=”#0c71c3″ sticky_enabled=”0″]
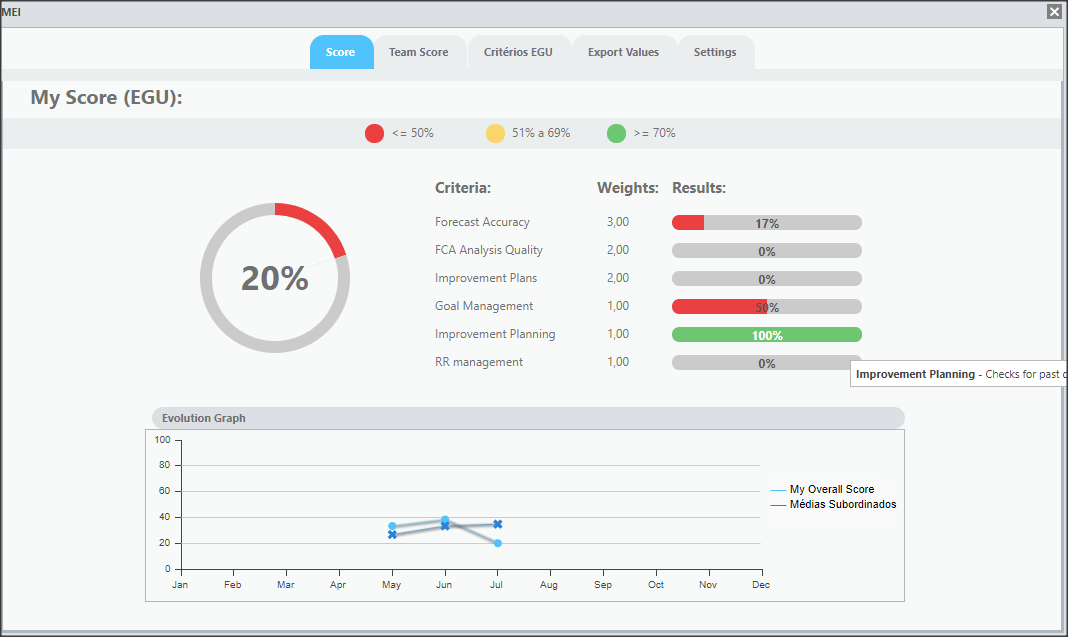
EGU screen
The EGU screen has a new design, modern, clean and intuitive.
In the My Notes tab, in My Score (EGU), we include a donut chart that displays the user’s note. On the right side of the screen, under Results, progress bars display the user’s scores for each EGU criterion.
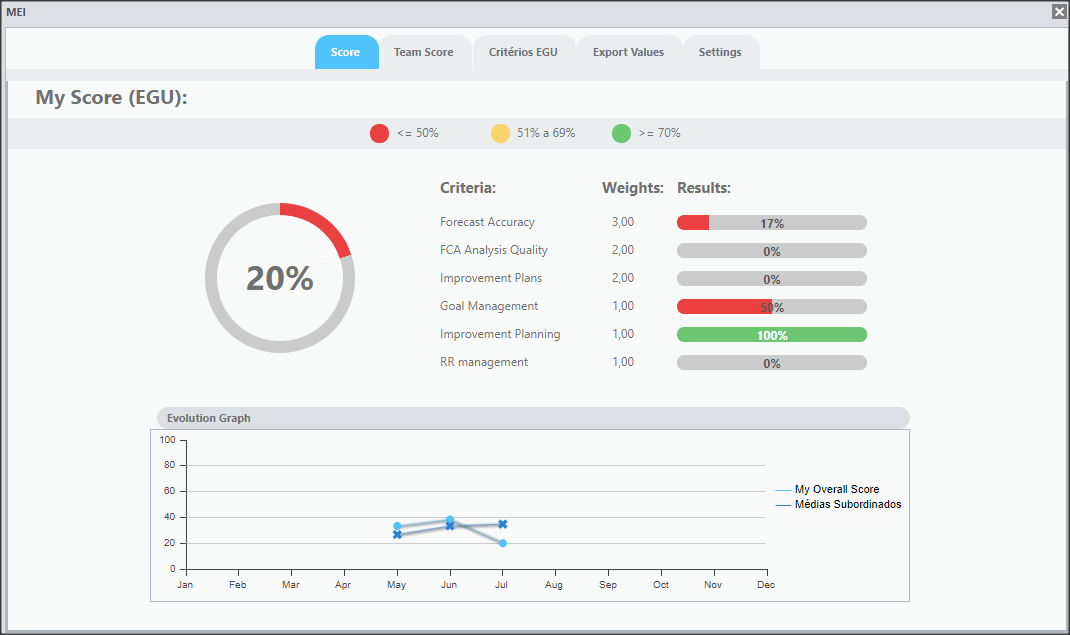
Both elements can be visualized through an animation that changes the colors and their filling according to the values reached by the user.
[/et_pb_text][et_pb_text ul_item_indent=”30px” _builder_version=”4.9.7″ custom_margin=”||0px||false|false” custom_padding=”|25px|0px|25px|false|true” hover_enabled=”0″ sticky_enabled=”0″]
EGU Colors
For both the Score Bar and the EGU screen, the colors are applied as follows:
- Red: from 0 to 50%
- Yellow: from 50 to 70%
- Green: from 70 to 100%
[/et_pb_text][et_pb_text _builder_version=”4.9.7″ custom_margin=”20px||0px” custom_padding=”|25px|0px|25px||true” hover_enabled=”0″ sticky_enabled=”0″]
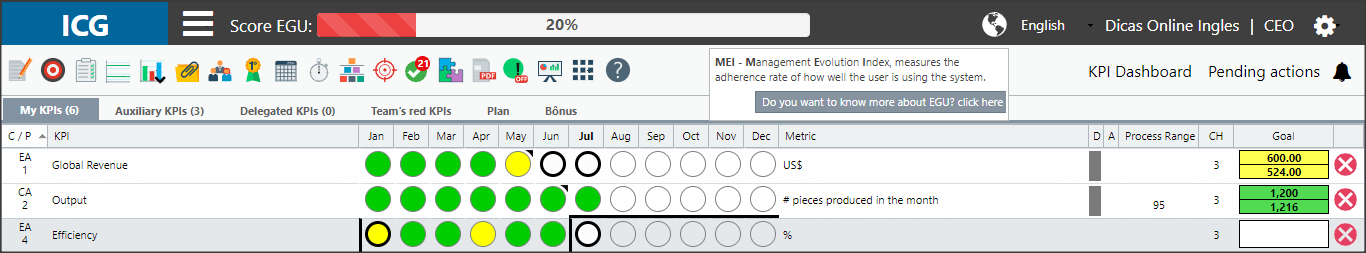
Tooltips
We have included tooltips with informative text and links to learn more.
On the Score Bar
In My Score (EGU)
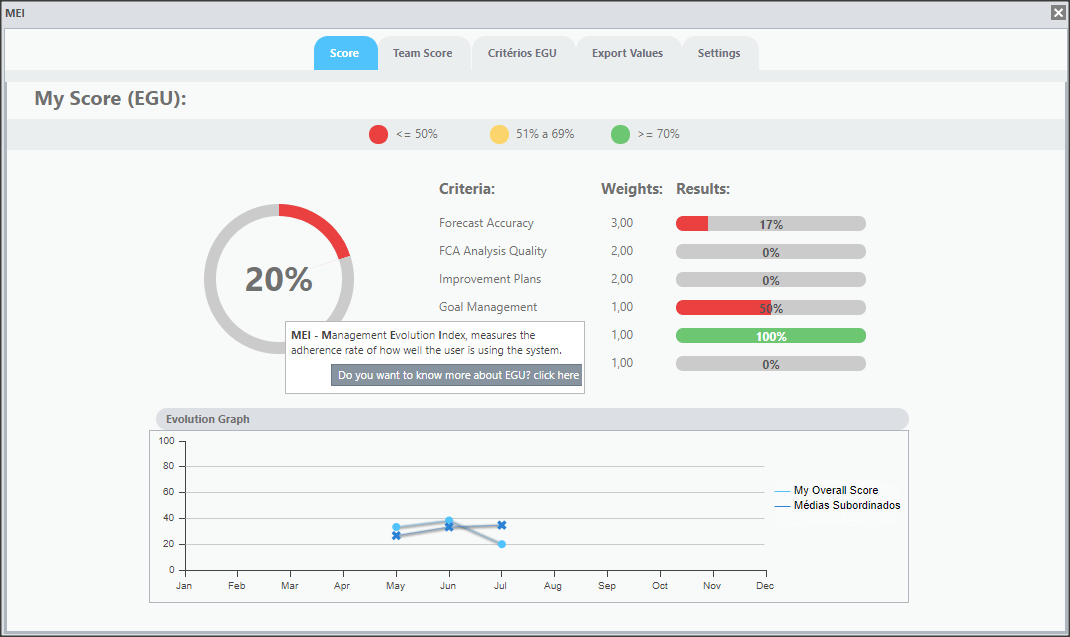
In results
[/et_pb_text][et_pb_text _builder_version=”3.27.4″ custom_margin=”||” custom_padding=”|25px||25px||true” box_shadow_style=”preset3″]
TESTE
[/et_pb_text][/et_pb_column][et_pb_column type=”1_5″ _builder_version=”3.25″ custom_padding=”|||” custom_padding__hover=”|||”][et_pb_image src=”https://suporte.quattrus.com/wp-content/uploads/2021/03/Artboard-2-copy-5.jpg” title_text=”Artboard 2 copy 5″ align_tablet=”center” align_phone=”” align_last_edited=”on|desktop” disabled_on=”on|on|” admin_label=”ESP – Banner – Contato Suporte” _builder_version=”4.9.2″ z_index=”0″ always_center_on_mobile=”on” saved_tabs=”all” locked=”off”][/et_pb_image][et_pb_image src=”https://suporte.quattrus.com/wp-content/uploads/2021/03/Prancheta-1.jpg” title_text=”Prancheta 1″ url=”https://www.qualitin.com.br/consultoria/” url_new_window=”on” align_tablet=”center” align_phone=”” align_last_edited=”on|desktop” disabled_on=”on|on|” admin_label=”Banner – Consultoria” _builder_version=”4.9.2″ max_width=”100%” saved_tabs=”all” locked=”off”][/et_pb_image][/et_pb_column][/et_pb_row][/et_pb_section]


 Português
 Español