[et_pb_section fb_built=”1″ _builder_version=”4.4.8″][et_pb_row column_structure=”1_5,3_5,1_5″ module_class=” et_pb_row_fullwidth” _builder_version=”3.25″ width=”89%” width_tablet=”80%” width_phone=”” width_last_edited=”on|desktop” max_width=”89%” max_width_tablet=”80%” max_width_phone=”” max_width_last_edited=”on|desktop” module_alignment=”center” custom_margin=”||5px|” custom_padding=”||0px|” make_fullwidth=”on”][et_pb_column type=”1_5″ _builder_version=”3.25″ custom_padding=”|||” custom_padding__hover=”|||”][et_pb_text disabled_on=”on|on|” admin_label=”Itens Usuário – Navegação vertical” _builder_version=”4.9.2″ max_width=”100%” z_index_tablet=”500″ saved_tabs=”all” locked=”off”]
[/et_pb_text][et_pb_text disabled_on=”on|on|” admin_label=”Artigos Relacionados” _builder_version=”4.9.2″ text_font=”|600|||||||” text_text_color=”#727272″ header_line_height=”1.1em” header_2_font=”|800||||on|||” header_2_text_align=”left” header_2_text_color=”#494949″ header_3_font=”|600|||||||” header_3_text_color=”#494949″ header_3_font_size=”14px” header_3_line_height=”1.2em” module_alignment=”left” z_index_tablet=”500″ text_text_shadow_horizontal_length_tablet=”0px” text_text_shadow_vertical_length_tablet=”0px” text_text_shadow_blur_strength_tablet=”1px” link_text_shadow_horizontal_length_tablet=”0px” link_text_shadow_vertical_length_tablet=”0px” link_text_shadow_blur_strength_tablet=”1px” ul_text_shadow_horizontal_length_tablet=”0px” ul_text_shadow_vertical_length_tablet=”0px” ul_text_shadow_blur_strength_tablet=”1px” ol_text_shadow_horizontal_length_tablet=”0px” ol_text_shadow_vertical_length_tablet=”0px” ol_text_shadow_blur_strength_tablet=”1px” quote_text_shadow_horizontal_length_tablet=”0px” quote_text_shadow_vertical_length_tablet=”0px” quote_text_shadow_blur_strength_tablet=”1px” header_text_shadow_horizontal_length_tablet=”0px” header_text_shadow_vertical_length_tablet=”0px” header_text_shadow_blur_strength_tablet=”1px” header_2_text_shadow_horizontal_length_tablet=”0px” header_2_text_shadow_vertical_length_tablet=”0px” header_2_text_shadow_blur_strength_tablet=”1px” header_3_text_shadow_horizontal_length_tablet=”0px” header_3_text_shadow_vertical_length_tablet=”0px” header_3_text_shadow_blur_strength_tablet=”1px” header_4_text_shadow_horizontal_length_tablet=”0px” header_4_text_shadow_vertical_length_tablet=”0px” header_4_text_shadow_blur_strength_tablet=”1px” header_5_text_shadow_horizontal_length_tablet=”0px” header_5_text_shadow_vertical_length_tablet=”0px” header_5_text_shadow_blur_strength_tablet=”1px” header_6_text_shadow_horizontal_length_tablet=”0px” header_6_text_shadow_vertical_length_tablet=”0px” header_6_text_shadow_blur_strength_tablet=”1px” box_shadow_horizontal_tablet=”0px” box_shadow_vertical_tablet=”0px” box_shadow_blur_tablet=”40px” box_shadow_spread_tablet=”0px” saved_tabs=”all” locked=”off”]
Related Posts
[/et_pb_text][/et_pb_column][et_pb_column type=”3_5″ _builder_version=”3.25″ custom_padding=”|||” custom_padding__hover=”|||”][et_pb_post_title meta=”off” featured_image=”off” _builder_version=”3.17.6″ title_font=”|700||||on|||” title_font_size=”36px” custom_margin=”||20px” border_width_bottom=”5px” border_color_bottom=”#0c71c3″][/et_pb_post_title][et_pb_text _builder_version=”4.9.10″ hover_enabled=”0″ sticky_enabled=”0″]
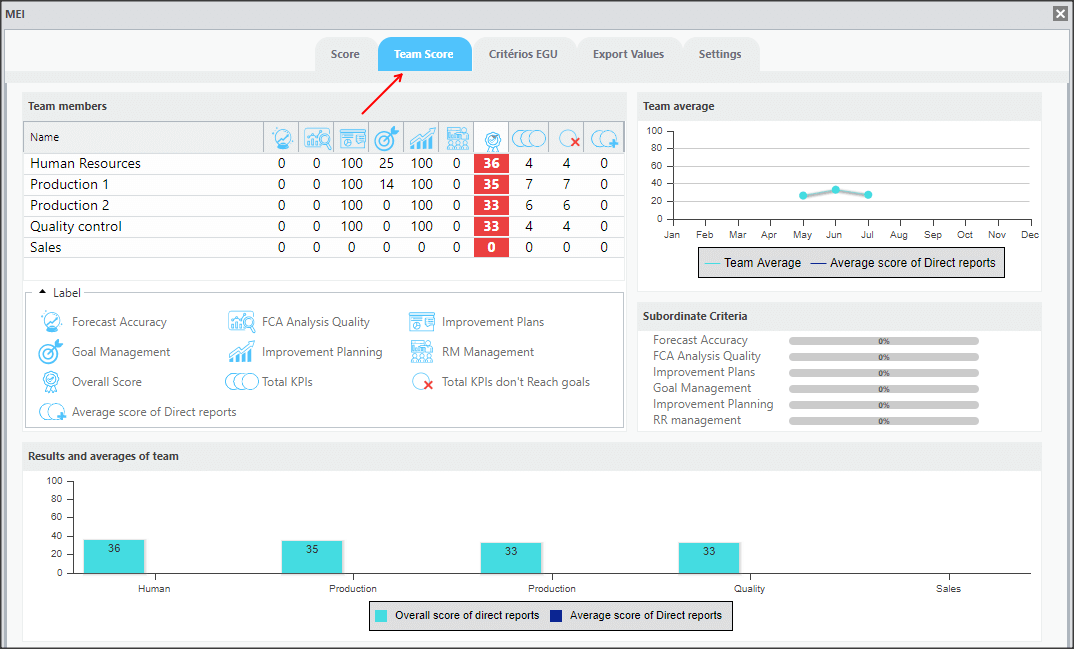
In the Subordinates’ Notes tab, you can follow how your team is performing in each of the EGU criteria.
To access it, just select it on the EGU screen:
[/et_pb_text][et_pb_text _builder_version=”4.9.10″ hover_enabled=”0″ sticky_enabled=”0″]
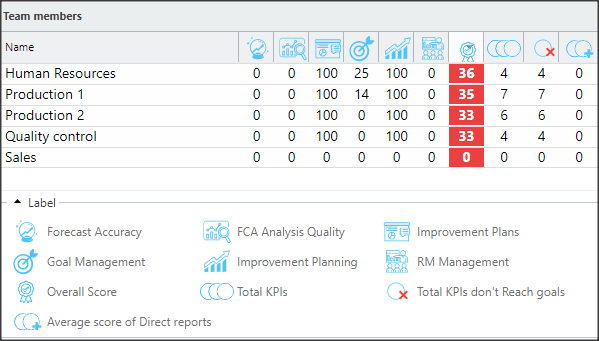
In the Subordinate section, you will see a dashboard with subordinated users in relation to each of the EGU criteria and some additional information.
Below, you have the meaning of all the values presented.
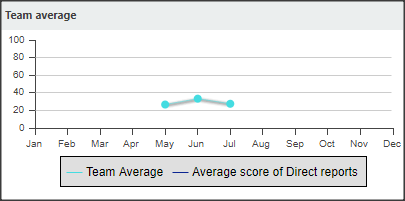
In Average of Subordinates, you will see the chart with the average score of all direct reports and you will also be able to see the average of the next level.
As subordinate has other users reporting to him, his team’s average score will appear in the Next Level Average column and on the chart.
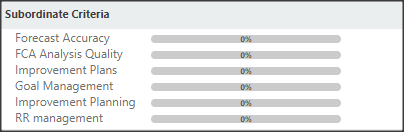
Under Subordinate Criteria, you will see the scores for each of your subordinates’ EGU criteria. The color of the bars will appear according to the percentage of the result, being: red for grades below 50%, yellow for 51% to 69% and green for grades above 70%.
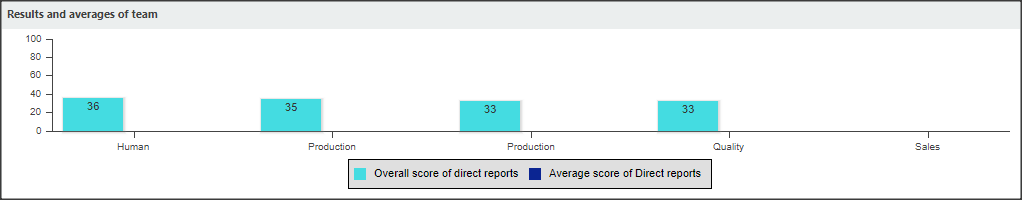
In the Subordinates’ Notes and Averages section, you can view the average score and the average of the next level of each of the subordinates through the bar chart.
[/et_pb_text][/et_pb_column][et_pb_column type=”1_5″ _builder_version=”3.25″ custom_padding=”|||” custom_padding__hover=”|||”][et_pb_image src=”https://suporte.quattrus.com/wp-content/uploads/2021/03/Artboard-2-copy-5.jpg” title_text=”Artboard 2 copy 5″ align_tablet=”center” align_phone=”” align_last_edited=”on|desktop” disabled_on=”on|on|” admin_label=”ESP – Banner – Contato Suporte” _builder_version=”4.9.2″ z_index=”0″ always_center_on_mobile=”on” saved_tabs=”all” locked=”off”][/et_pb_image][et_pb_image src=”https://suporte.quattrus.com/wp-content/uploads/2021/03/Prancheta-1.jpg” title_text=”Prancheta 1″ url=”https://www.qualitin.com.br/consultoria/” url_new_window=”on” align_tablet=”center” align_phone=”” align_last_edited=”on|desktop” disabled_on=”on|on|” admin_label=”Banner – Consultoria” _builder_version=”4.9.2″ max_width=”100%” saved_tabs=”all” locked=”off”][/et_pb_image][/et_pb_column][/et_pb_row][/et_pb_section]


 Português