Português
 Español
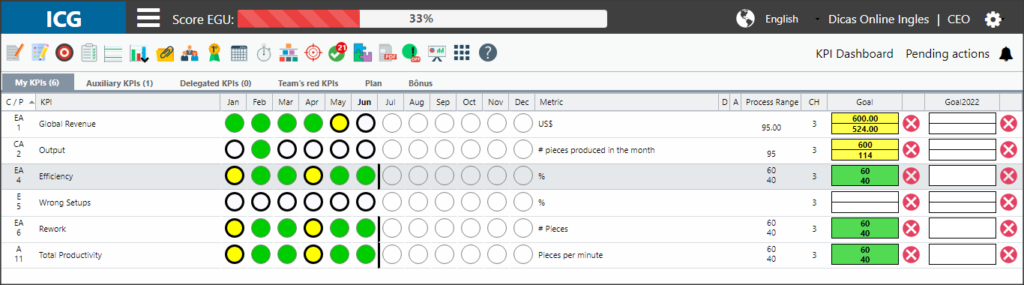
At the top you will find the following information:
![]()
When clicking on the ICG button, the system will return to its initial dashboard. Next to the button is the “Three bars” menu where you have access to the most advanced options.
In the center of the screen is your EGU Score. There you can track your EGU score in real time.
In the right corner, you will see a globe where you can change the ICG language. The company information and the name of the user responsible for the ICG table are attached to the side.
Observation:
When a manager clicks to view another user’s ICG, company and user information will appear as follows:![]()
Notice that the company is referring to the selected user, that is, the Administrative Manager, belongs to the company “Dicas Online1” and “Gestor Compras” as well, in this case.
Finally, we have the gear icon, where you can check more information about the logged in user, access the settings and log out.
Below you will see the ICG icons, visit the ICG Menu article to understand what each icon means.
![]()
At the bottom you can view the ICG version and in the right corner you can click to access the Support Portal.
![]()
- My KPIs
In this tab are located the Main KPIs. You will need to manage these items.

- My Auxiliary KPIs
In this tab are located the Auxiliary KPIs, that is, items that do not need management, but support the analysis and monitoring of the main KPIs

- Delegated KPIs
KPIs that are delegated from my leader/manager to me. When the user completes the measurements, action plan and FCA, it will automatically appear to the leader/manager.

- Subordinate Red
When a subordinate’s KPI has the red beacon of the month or the red Customer Band, the KPI will appear in this tab so that the leader/manager can follow up.

- Totalized KPIs and Linked KPIs
When column D is marked with a gray stripe, it means that the KPI is linked or totaled.
PTo learn more, visit the Totalized KPI article.

Understanding the Columns
![]()
1. Owner: Indicates the user that the KPI belongs to.
2. C/P: Referring to Customer S.E.C.T. and the priority of the items.
To learn more, visit the article S.E.C.T.
3. My KPIs: Name of the KPI.
4. Months: Represent the performance of each KPI by comparing what has been done with the forecast for each month.
5. Metric: Represents the unit of measurement for each KPI.
6. D: Indication if the KPI is unfolded, linked or totalized.
7. A: If you have an attachment to the KPI, a paper clip will appear.
8. Green Band: Forecast for each KPI.
9. CH: Chronic red.
To learn more, visit the article What is the Chronic Red?
10. Goal: Represents the expected goal for each KPI.
- Action Plan
In this tab it will be possible to register or consult an Action Plan.

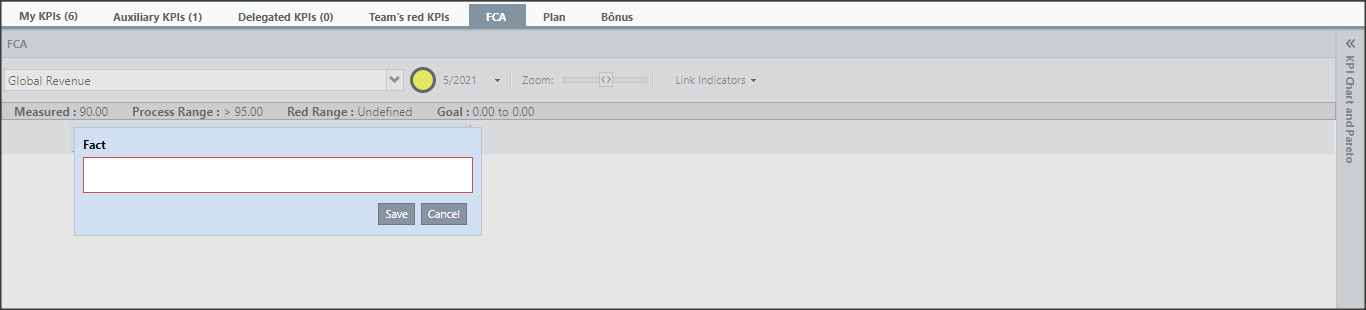
- FCA (Fact – Cause – Action)
When a result for the month has gone out of range (beacon is not green), a black outline will appear around the beacon. When you click on this beacon, the FCA tab will be available.
In this tab you will analyze the causes for your result to be out of the expected.