Português
 Español
Aggregation and Linkage: Viewing in Gestiona
In this article, you will learn how to view the breakdown of your control items. There are two types of breakdown: Aggregation and Linkage.
In this article, we will cover:
- Viewing an Aggregation of items
- Viewing a Linkage of items
Gestiona displays all details of item breakdown in a cascading manner, integrated with the items on your dashboard. When creating a new aggregation or linkage, you will have an arrow that allows you to expand the breakdown structure, as applicable.
This way, you can easily navigate between all levels of the structure, viewing items and their results quickly, dynamically, and intuitively.
IMPORTANT:
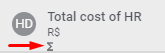
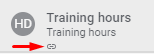
Gestiona distinguishes aggregations and linkages through an icon:
Agregations:
Linkages:
Viewing an Aggregation of Items
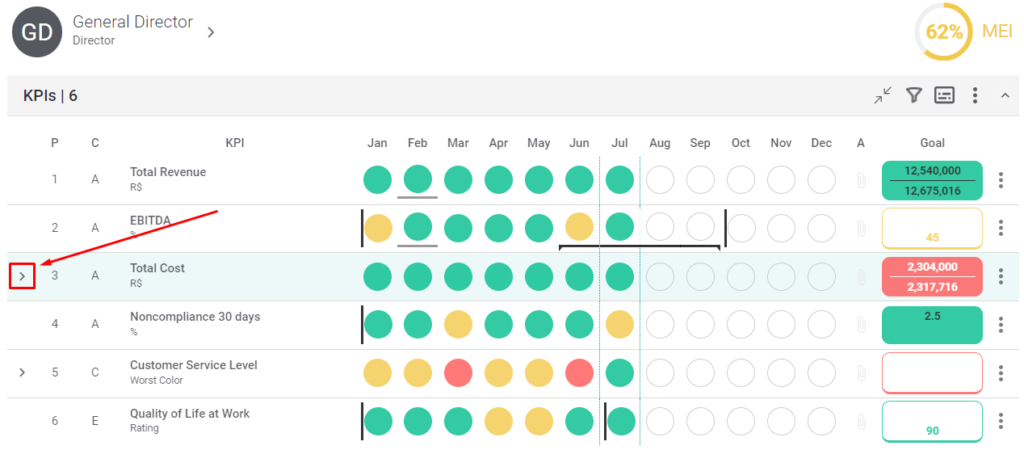
On your Dashboard, click the arrow of an item that has an aggregation.
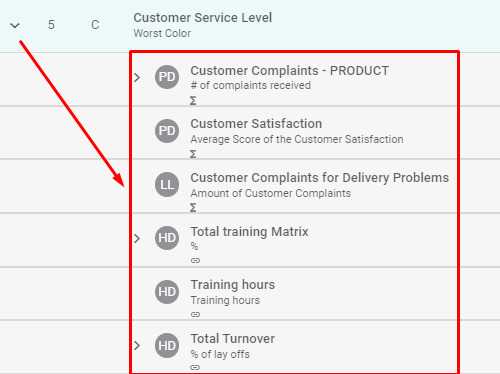
The system will expand the aggregation, and you will see that there are three items below.
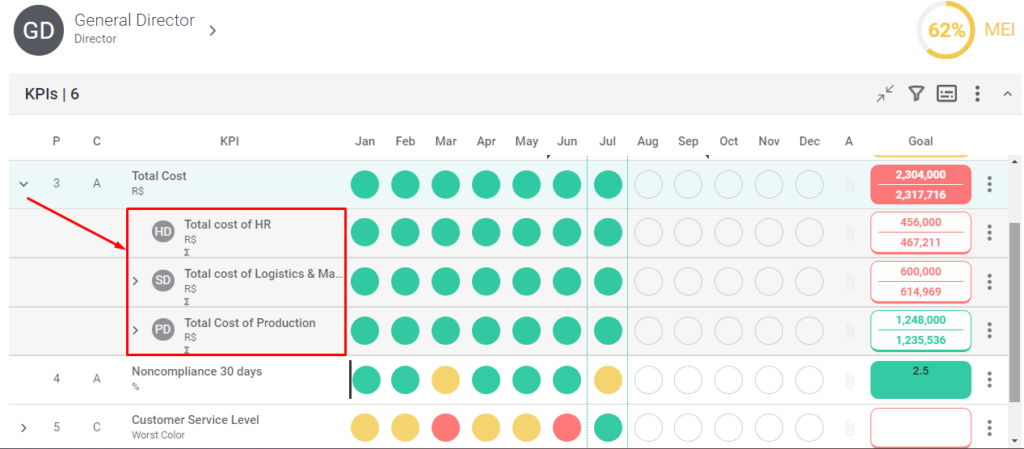
Note that there is also an arrow to the left of the item names for Branch 1 and 2. This means that this control item is also aggregated. Click the arrows of the items to expand and view the items that make up this aggregation.
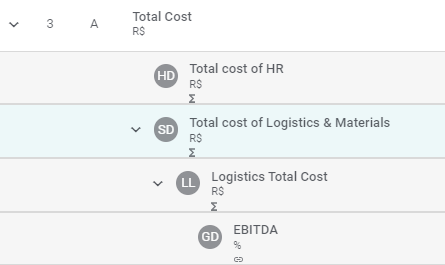
In cases where there are more levels of aggregation, simply click the arrows of the items to expand and view the control items of the lower levels. As the structure expands, you will see how the items relate on a single screen.
IMPORTANT:
In the AGGREGATION tab, only data for AGGREGATED items can be viewed.In the LINKAGE tab, only data for LINKED items can be viewed.
Viewing a Linkage of Items
In this example, click on the Expenses Item.
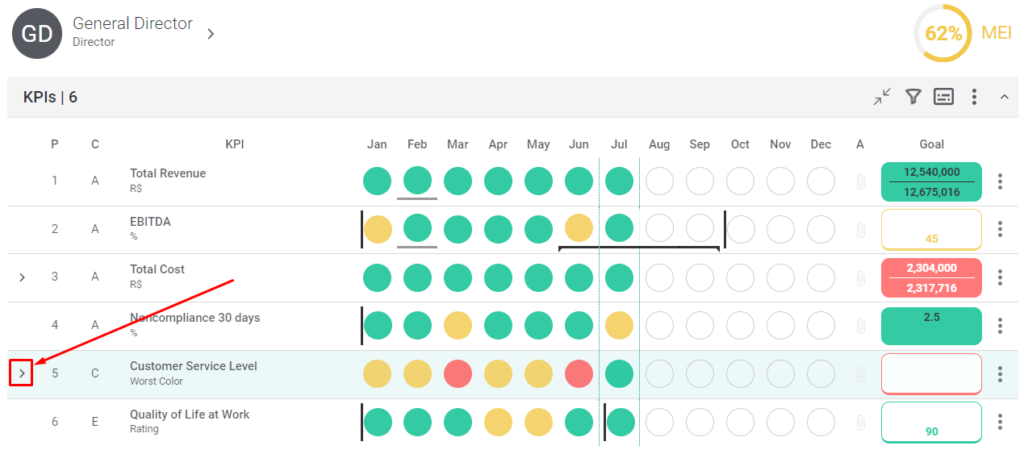
When you click the arrow, you will see the same cascading structure as in the previous example.
To view all levels of linkage, simply click the arrows to expand the view.