[et_pb_section fb_built=”1″ _builder_version=”4.4.8″][et_pb_row column_structure=”1_5,3_5,1_5″ module_class=” et_pb_row_fullwidth” _builder_version=”3.25″ width=”89%” width_tablet=”80%” width_phone=”” width_last_edited=”on|desktop” max_width=”89%” max_width_tablet=”80%” max_width_phone=”” max_width_last_edited=”on|desktop” make_fullwidth=”on”][et_pb_column type=”1_5″ _builder_version=”3.25″ custom_padding=”|||” custom_padding__hover=”|||”][et_pb_text disabled_on=”on|on|” admin_label=”Itens Usuário – Navegação vertical” _builder_version=”4.9.2″ max_width=”100%” z_index_tablet=”500″ saved_tabs=”all” locked=”off”]
[/et_pb_text][et_pb_text disabled_on=”on|on|” admin_label=”Artigos Relacionados” _builder_version=”4.9.2″ text_font=”|600|||||||” text_text_color=”#727272″ header_line_height=”1.1em” header_2_font=”|800||||on|||” header_2_text_align=”left” header_2_text_color=”#494949″ header_3_font=”|600|||||||” header_3_text_color=”#494949″ header_3_font_size=”14px” header_3_line_height=”1.2em” module_alignment=”left” z_index_tablet=”500″ text_text_shadow_horizontal_length_tablet=”0px” text_text_shadow_vertical_length_tablet=”0px” text_text_shadow_blur_strength_tablet=”1px” link_text_shadow_horizontal_length_tablet=”0px” link_text_shadow_vertical_length_tablet=”0px” link_text_shadow_blur_strength_tablet=”1px” ul_text_shadow_horizontal_length_tablet=”0px” ul_text_shadow_vertical_length_tablet=”0px” ul_text_shadow_blur_strength_tablet=”1px” ol_text_shadow_horizontal_length_tablet=”0px” ol_text_shadow_vertical_length_tablet=”0px” ol_text_shadow_blur_strength_tablet=”1px” quote_text_shadow_horizontal_length_tablet=”0px” quote_text_shadow_vertical_length_tablet=”0px” quote_text_shadow_blur_strength_tablet=”1px” header_text_shadow_horizontal_length_tablet=”0px” header_text_shadow_vertical_length_tablet=”0px” header_text_shadow_blur_strength_tablet=”1px” header_2_text_shadow_horizontal_length_tablet=”0px” header_2_text_shadow_vertical_length_tablet=”0px” header_2_text_shadow_blur_strength_tablet=”1px” header_3_text_shadow_horizontal_length_tablet=”0px” header_3_text_shadow_vertical_length_tablet=”0px” header_3_text_shadow_blur_strength_tablet=”1px” header_4_text_shadow_horizontal_length_tablet=”0px” header_4_text_shadow_vertical_length_tablet=”0px” header_4_text_shadow_blur_strength_tablet=”1px” header_5_text_shadow_horizontal_length_tablet=”0px” header_5_text_shadow_vertical_length_tablet=”0px” header_5_text_shadow_blur_strength_tablet=”1px” header_6_text_shadow_horizontal_length_tablet=”0px” header_6_text_shadow_vertical_length_tablet=”0px” header_6_text_shadow_blur_strength_tablet=”1px” box_shadow_horizontal_tablet=”0px” box_shadow_vertical_tablet=”0px” box_shadow_blur_tablet=”40px” box_shadow_spread_tablet=”0px” saved_tabs=”all” locked=”off”]
Related Posts
[/et_pb_text][/et_pb_column][et_pb_column type=”3_5″ _builder_version=”3.25″ custom_padding=”|||” custom_padding__hover=”|||”][et_pb_post_title meta=”off” featured_image=”off” _builder_version=”3.19.18″ title_font=”|700||||on|||” title_font_size=”36px” border_width_bottom=”5″ border_color_bottom=”#0c71c3″][/et_pb_post_title][et_pb_text admin_label=”Info” _builder_version=”4.9.7″ text_font=”||on||||||” text_font_size=”12px” text_letter_spacing=”1px” text_line_height=”1.5em” custom_margin=”-40px|0px||” custom_margin_tablet=”-20px|0px||” custom_margin_phone=”” custom_margin_last_edited=”on|desktop” custom_padding=”0px|0px||” z_index_tablet=”500″]
The Pareto Principle says that by focusing on 20% of potential causes, 80% of problems would tend to be resolved. The Pareto Chart is a tool to help focus improvement efforts, it is important to note that its purpose is not to identify the causes of the problem, for this, use the FCA tool.
[/et_pb_text][et_pb_video src=”https://youtu.be/C_trpDEWCKA” _builder_version=”4.6.0″ _module_preset=”default”][/et_pb_video][et_pb_text _builder_version=”4.9.7″ background_color=”rgba(70,168,201,0.34)” custom_margin=”|65px|35px|70px” custom_margin_tablet=”” custom_margin_phone=”|25px||25px” custom_margin_last_edited=”on|phone” custom_padding=”10px|15px|10px|20px|true” border_width_left=”5px” border_color_left=”rgba(32,159,201,0.59)” box_shadow_style=”preset3″ saved_tabs=”all”]
RELATED ARTICLES:
– Pareto: What is
– Pareto: How to do it
– Pareto: Copy Structure
– Pareto: Usability Tips
[/et_pb_text][et_pb_text _builder_version=”4.9.7″ custom_margin=”-10px||-20px|” custom_padding=”|25px||25px” hover_enabled=”0″ border_color_top=”#0c71c3″ sticky_enabled=”0″]
When there is a beacon with the indication of an arrow, as shown below, it means that in that month there is a pareto or a bar chart.
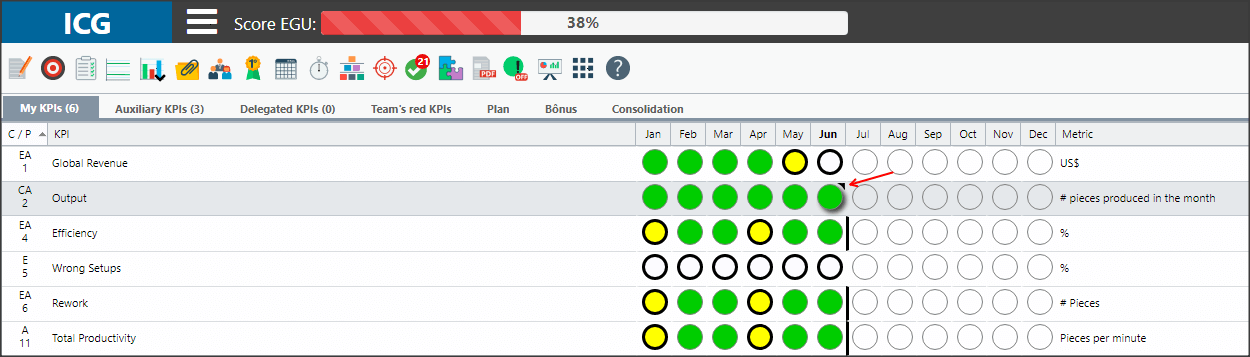
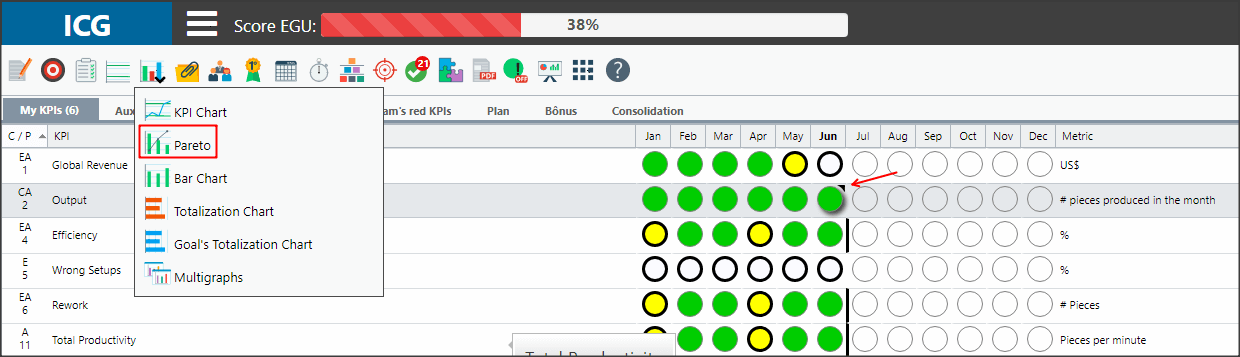
Select the desired month, click on the charts icon and select the Pareto option.
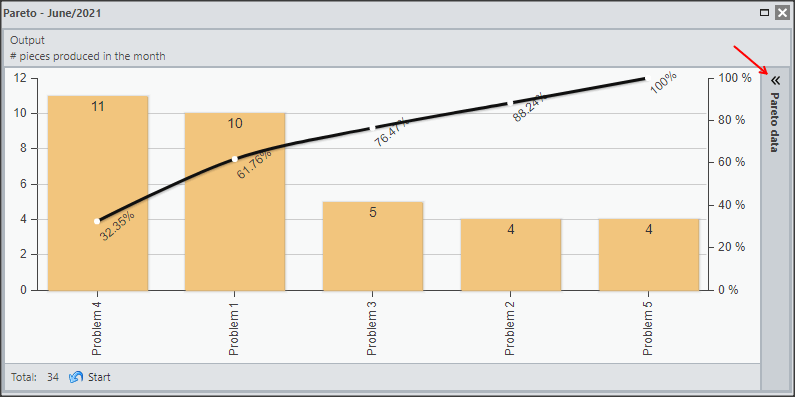
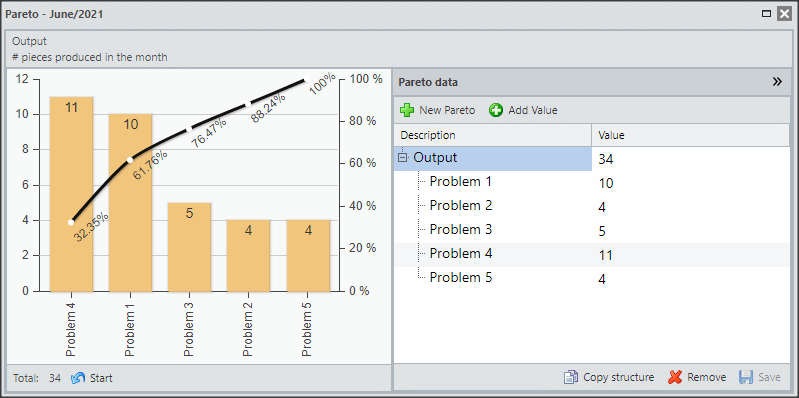
You will see the Pareto chart. To view the structure, click on Pareto Data.
In this way it will be possible to visualize the structure of the Pareto.
[/et_pb_text][et_pb_text admin_label=”Borda Inferior” _builder_version=”3.27.4″ custom_margin=”20px||20px|” custom_padding=”|25px||25px” box_shadow_style=”preset3″]
TESTE
[/et_pb_text][/et_pb_column][et_pb_column type=”1_5″ _builder_version=”3.25″ custom_padding=”|||” custom_padding__hover=”|||”][et_pb_image src=”https://suporte.quattrus.com/wp-content/uploads/2021/03/Artboard-2-copy-5.jpg” title_text=”Artboard 2 copy 5″ align_tablet=”center” align_phone=”” align_last_edited=”on|desktop” disabled_on=”on|on|” admin_label=”ESP – Banner – Contato Suporte” _builder_version=”4.9.2″ z_index=”0″ always_center_on_mobile=”on” saved_tabs=”all” locked=”off”][/et_pb_image][et_pb_image src=”https://suporte.quattrus.com/wp-content/uploads/2021/03/Prancheta-1.jpg” title_text=”Prancheta 1″ url=”https://www.qualitin.com.br/consultoria/” url_new_window=”on” align_tablet=”center” align_phone=”” align_last_edited=”on|desktop” disabled_on=”on|on|” admin_label=”Banner – Consultoria” _builder_version=”4.9.2″ max_width=”100%” saved_tabs=”all” locked=”off”][/et_pb_image][/et_pb_column][/et_pb_row][/et_pb_section]


 Português