

 Português
 Español
Related Posts
[/et_pb_text][/et_pb_column][et_pb_column type=”3_5″ _builder_version=”3.25″ custom_padding=”|||” global_colors_info=”{}” custom_padding__hover=”|||”][et_pb_post_title meta=”off” featured_image=”off” _builder_version=”3.19.17″ title_font=”|700||||on|||” title_font_size=”36px” border_width_bottom=”5px” border_color_bottom=”#0c71c3″ global_colors_info=”{}”] [/et_pb_post_title][et_pb_text admin_label=”Info” _builder_version=”4.9.7″ text_font=”||on||||||” text_font_size=”12px” text_letter_spacing=”1px” text_line_height=”1.5em” custom_margin=”-40px|0px||” custom_margin_tablet=”-20px|0px||” custom_margin_phone=”” custom_margin_last_edited=”on|desktop” custom_padding=”0px|0px||” z_index_tablet=”500″ locked=”off” global_colors_info=”{}”]
The ICG provides the chart of your KPI with the Measurement Grid. There you can view and analyze your measurements, assess how your KPI is behaving compared to previous years and make comparisons with other KPIs.
[/et_pb_text][et_pb_text _builder_version=”4.14.8″ custom_margin=”-50px|||||false” custom_padding=”20px|25px||25px||true” hover_enabled=”0″ border_color_top=”#0c71c3″ global_colors_info=”{}” sticky_enabled=”0″]To open a KPI’s chart, select the desired KPI and click the icon below. Then select the Chart option.
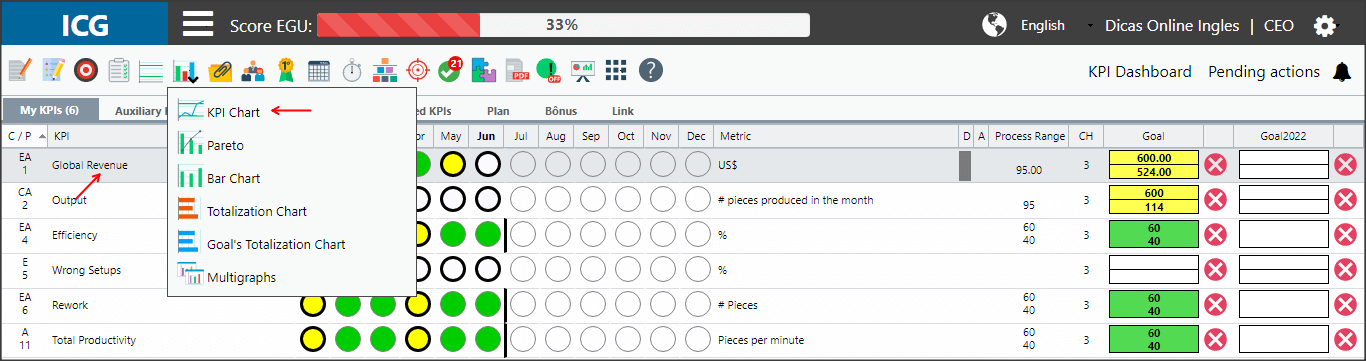
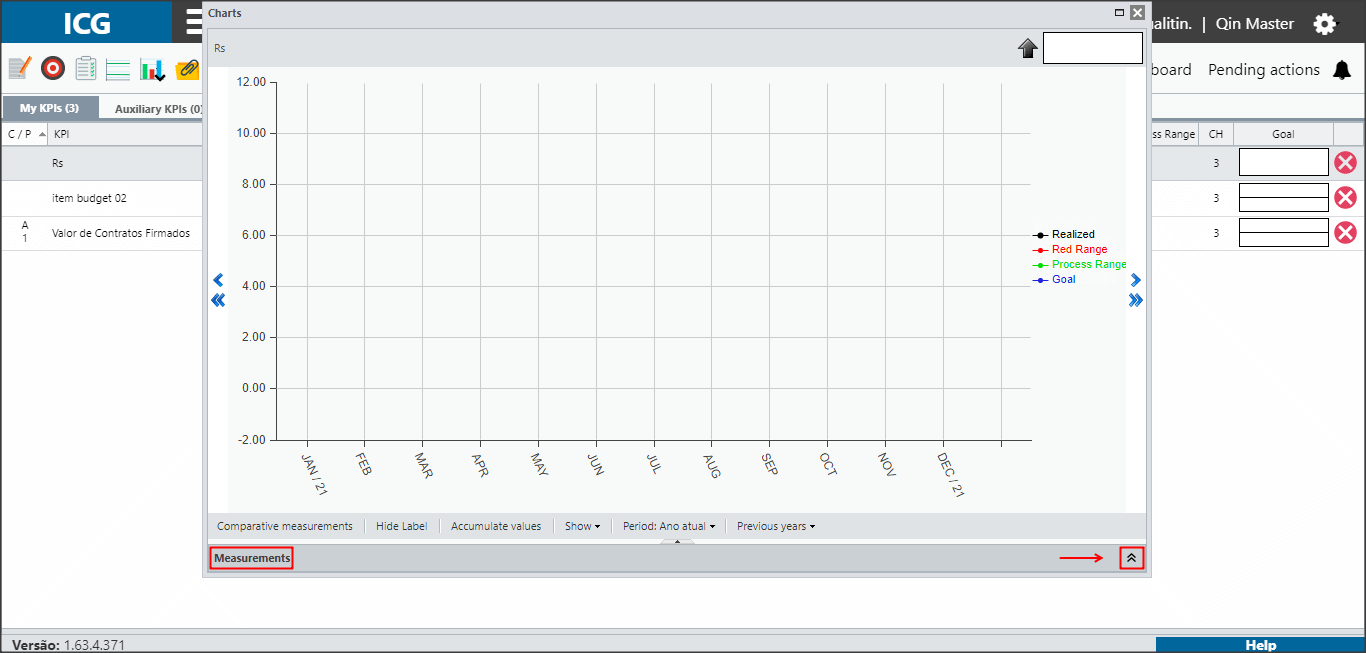
After opening the chart, you will need to click on the arrow indicated in the image, in the lower left corner of the graph tab, to expand the Measurement Grid.
To learn more about the functionality of the other buttons, access the article Chart: KPI Charts.
When clicking on the indicated arrow, the Grid will be displayed at the bottom of the chart’s tab.

[/et_pb_text][et_pb_text _builder_version=”4.9.7″ background_color=”rgba(70,168,201,0.34)” custom_margin=”-45px|15px||15px|false|false” custom_padding=”10px|15px|10px|20px|true” border_width_left=”5px” border_color_left=”rgba(32,159,201,0.59)” box_shadow_style=”preset3″ saved_tabs=”all” global_colors_info=”{}”]
IMPORTANT:
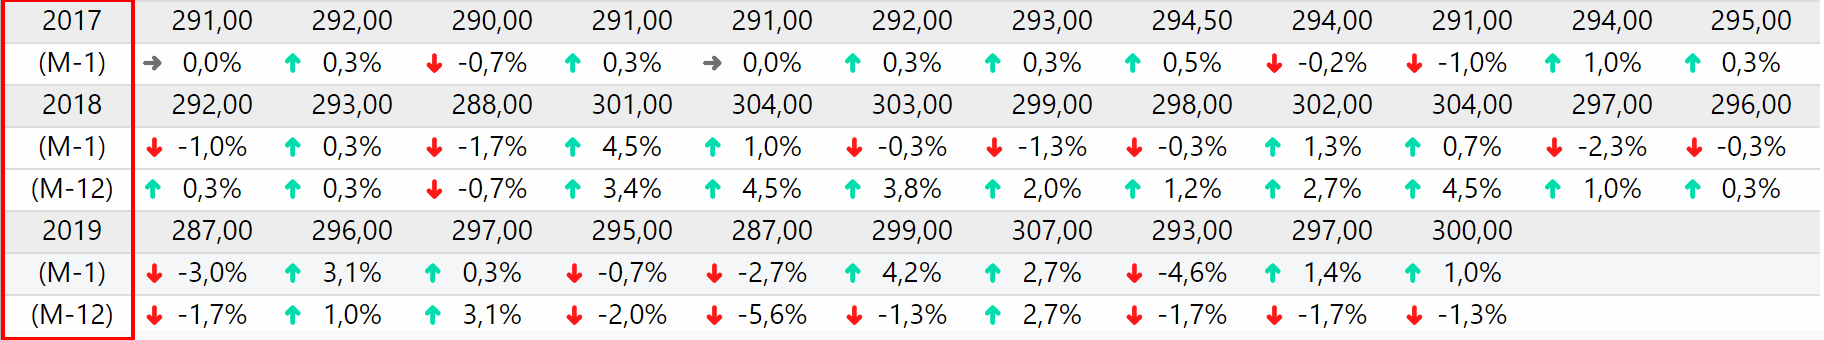
In the Measurement Grid, the system will always show 3 years, the current year and 2 years before, according to the base month configured in the ICG. The months selected in the chart do not interfere with the display of years in the Grid.
In the Measurement Grid, in addition to the measurement value shown on the line for each year, the ICG will also show:
- (M-1): indicates the percentage of the month’s measurement compared to the previous month’s measurement.
- (M-12): indicates the percentage of the month’s measurement compared to the same month’s measurement from the previous year.
You will identify that arrows will be displayed next to each percentage of comparison with the following concept:
| Grey Arrow | Indicates that your measurement for that KPI has not changed either up or down compared to previous results. | |
| Green Arrow | Indicates that your measurement for that KPI has INCREASED compared to previous results. | |
| Red Arrow | Indicates that your measurement for that KPI has REDUCED compared to previous result. |
[/et_pb_text][et_pb_text _builder_version=”4.9.7″ background_color=”rgba(226,127,77,0.27)” custom_margin=”-79px|15px||15px|false|false” custom_padding=”10px|15px|10px|20px|true” border_width_left=”5px” border_color_left=”rgba(198,72,33,0.68)” box_shadow_style=”preset3″ saved_tabs=”all” global_colors_info=”{}”]
NOTE:
If you are analyzing the last year of the comparison, example: Base month 2019, data prior to 2017 will not be displayed. Consequently, the months of 2017 will have no comparisons with the results of the previous year.
In the bar at the top of the Grid, the months from January to December will be displayed.
![]()
On the left side of the Grid, the last 3 years will be displayed and below each year the comparisons (M-1) compared to the previous month and (M-12) comparison with the same month of the previous year will be indicated.
TESTE
[/et_pb_text][/et_pb_column][et_pb_column type=”1_5″ _builder_version=”3.25″ custom_padding=”|||” global_colors_info=”{}” custom_padding__hover=”|||”][et_pb_image src=”https://suporte.quattrus.com/wp-content/uploads/2021/03/Artboard-2-copy-5.jpg” title_text=”Artboard 2 copy 5″ align_tablet=”center” align_phone=”” align_last_edited=”on|desktop” disabled_on=”on|on|” admin_label=”ESP – Banner – Contato Suporte” _builder_version=”4.9.2″ z_index=”0″ always_center_on_mobile=”on” saved_tabs=”all” locked=”off” global_colors_info=”{}”][/et_pb_image][et_pb_image src=”https://suporte.quattrus.com/wp-content/uploads/2021/03/Prancheta-1.jpg” title_text=”Prancheta 1″ url=”https://www.qualitin.com.br/consultoria/” url_new_window=”on” align_tablet=”center” align_phone=”” align_last_edited=”on|desktop” disabled_on=”on|on|” admin_label=”Banner – Consultoria” _builder_version=”4.9.2″ max_width=”100%” saved_tabs=”all” locked=”off” global_colors_info=”{}”][/et_pb_image][/et_pb_column][/et_pb_row][/et_pb_section]