

 Português
 Español
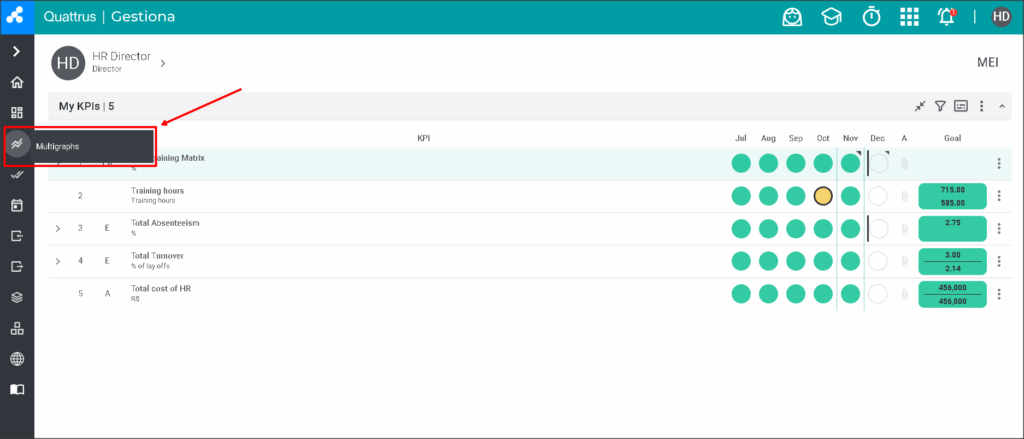
The Multi-Charts feature allows the simultaneous display of up to four charts, optimizing comparative analysis and KPI presentation.
To access it, hover over the chart icon in the sidebar and then select the Multi-Charts option:
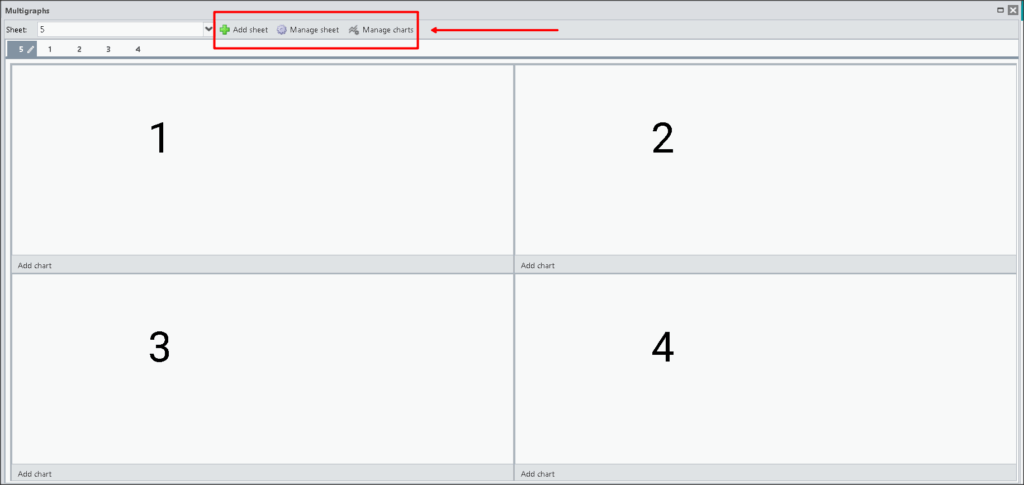
When accessing this feature, three options will appear in the header: Add Sheet, Manage Sheets, and Manage Charts.
To configure the charts, click Manage Charts or Add Chart.
Next, select the Sheet, the Chart Order to define the chart’s position on the screen, and the KPI.
The positions are determined by the numbers indicated in the layout:
- 1 and 2 correspond to the upper part of the screen.
- 3 and 4 correspond to the lower part.
After setting the configurations, click Add to insert the desired chart and Save to finalize.
To delete a chart, simply click the trash bin icon.
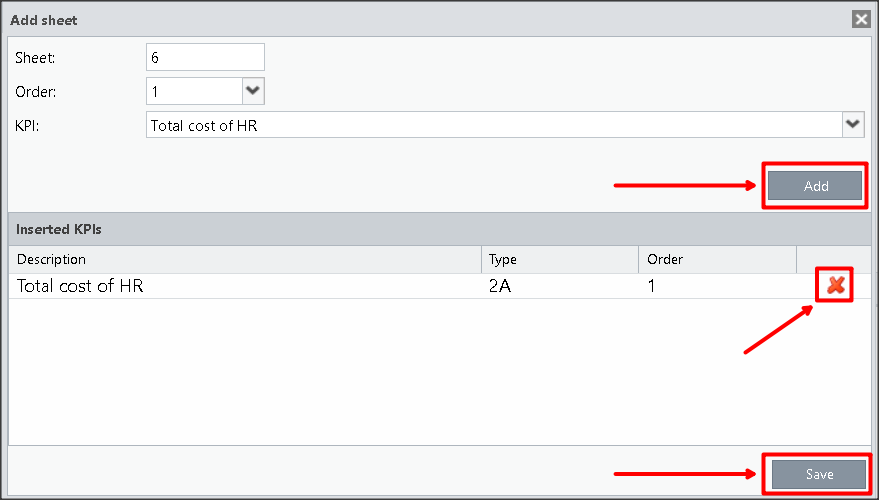
In the Add Sheet feature, you can add a tab, items, name it, and arrange the chart positions for it.
As with Manage Charts, it is also possible to delete a chart using the trash bin icon.
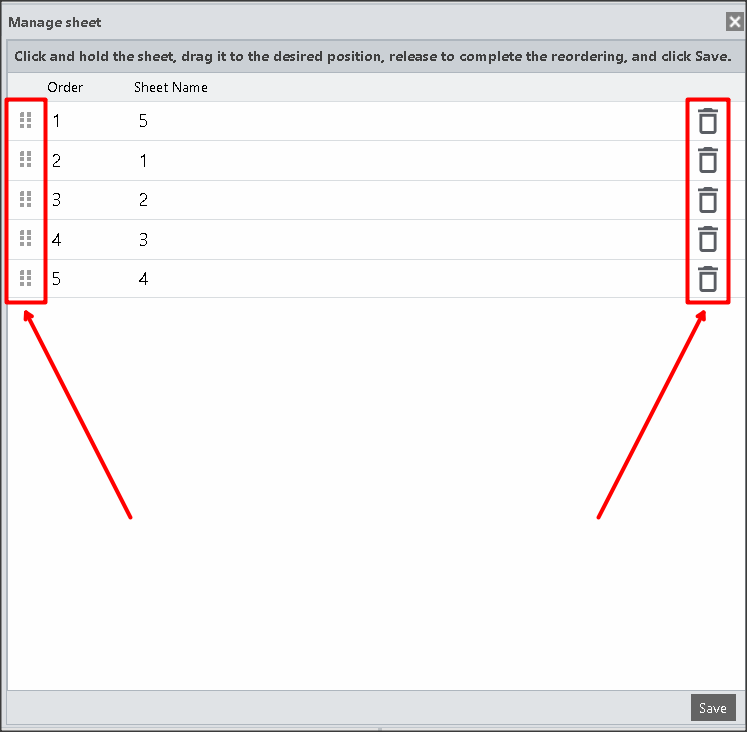
In Manage Sheets, you can reorder them by dragging and dropping up or down, either by clicking the tab name or the dotted icon on its left.
Again, you can delete them using the trash bin icon.
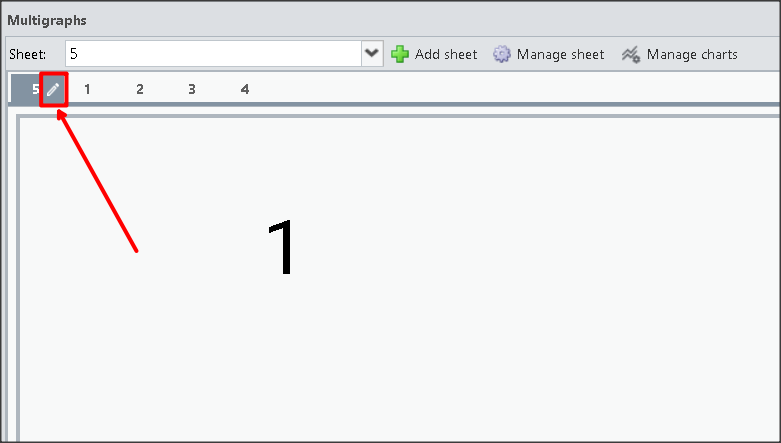
In the bar above the charts, you can view the tabs and their respective names.
By clicking the pencil icon next to the name, you can edit the sheet name.
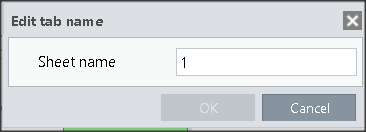
Simply edit the sheet name and click OK.
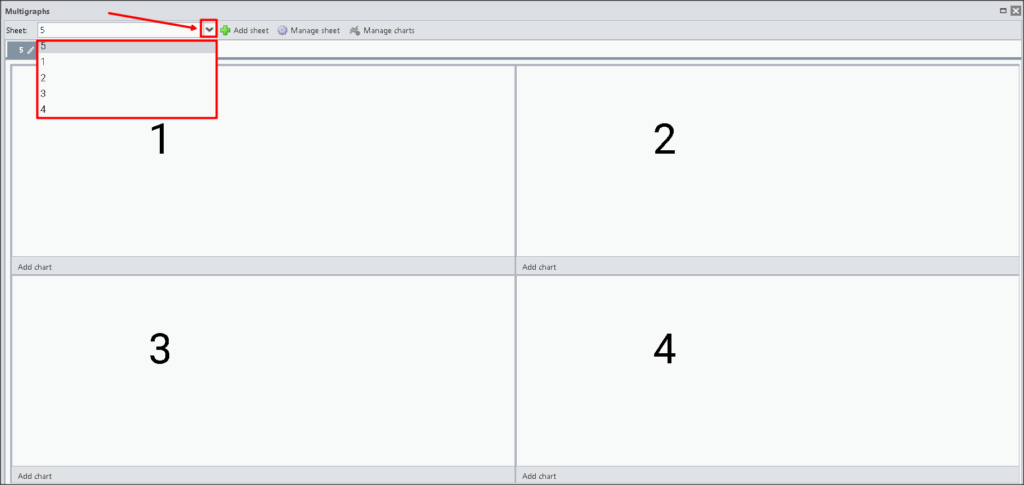
By clicking the arrow button located in the Sheet field, the Gestiona system will display a dropdown list with all the multi-chart tabs.
To view a tab’s information, select its name or number from the list.
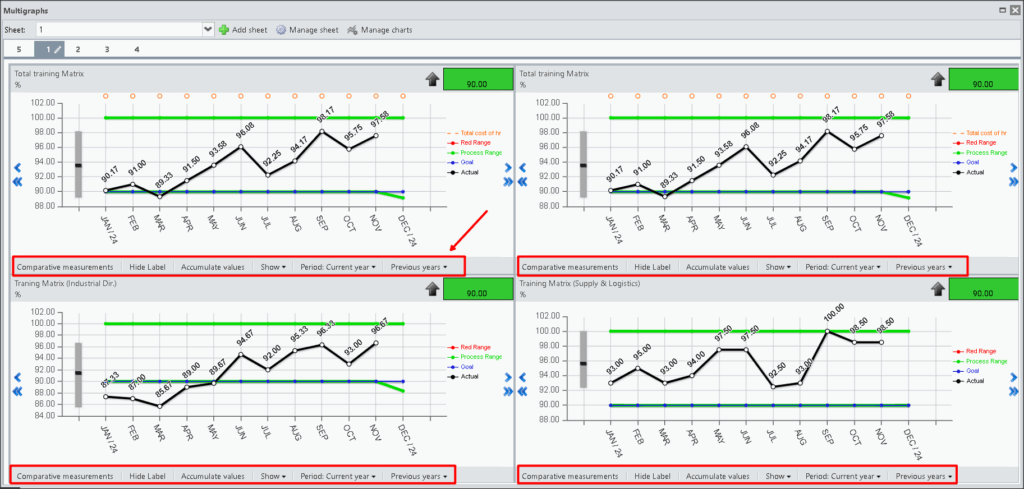
You can change the settings and select options for each chart individually.
For more information, see the KPI Charts article.
REMINDER:
When there is more than one sheet, pay attention when managing the charts to select the correct sheet.
To view the charts, just click on the desired sheet.The system automatically saves your changes, so it is not necessary to reconfigure the page when closing and reopening it.