

 Español
The Multigraphs feature allows you to view up to four charts simultaneously, optimizing comparative analysis and the presentation of indicators.
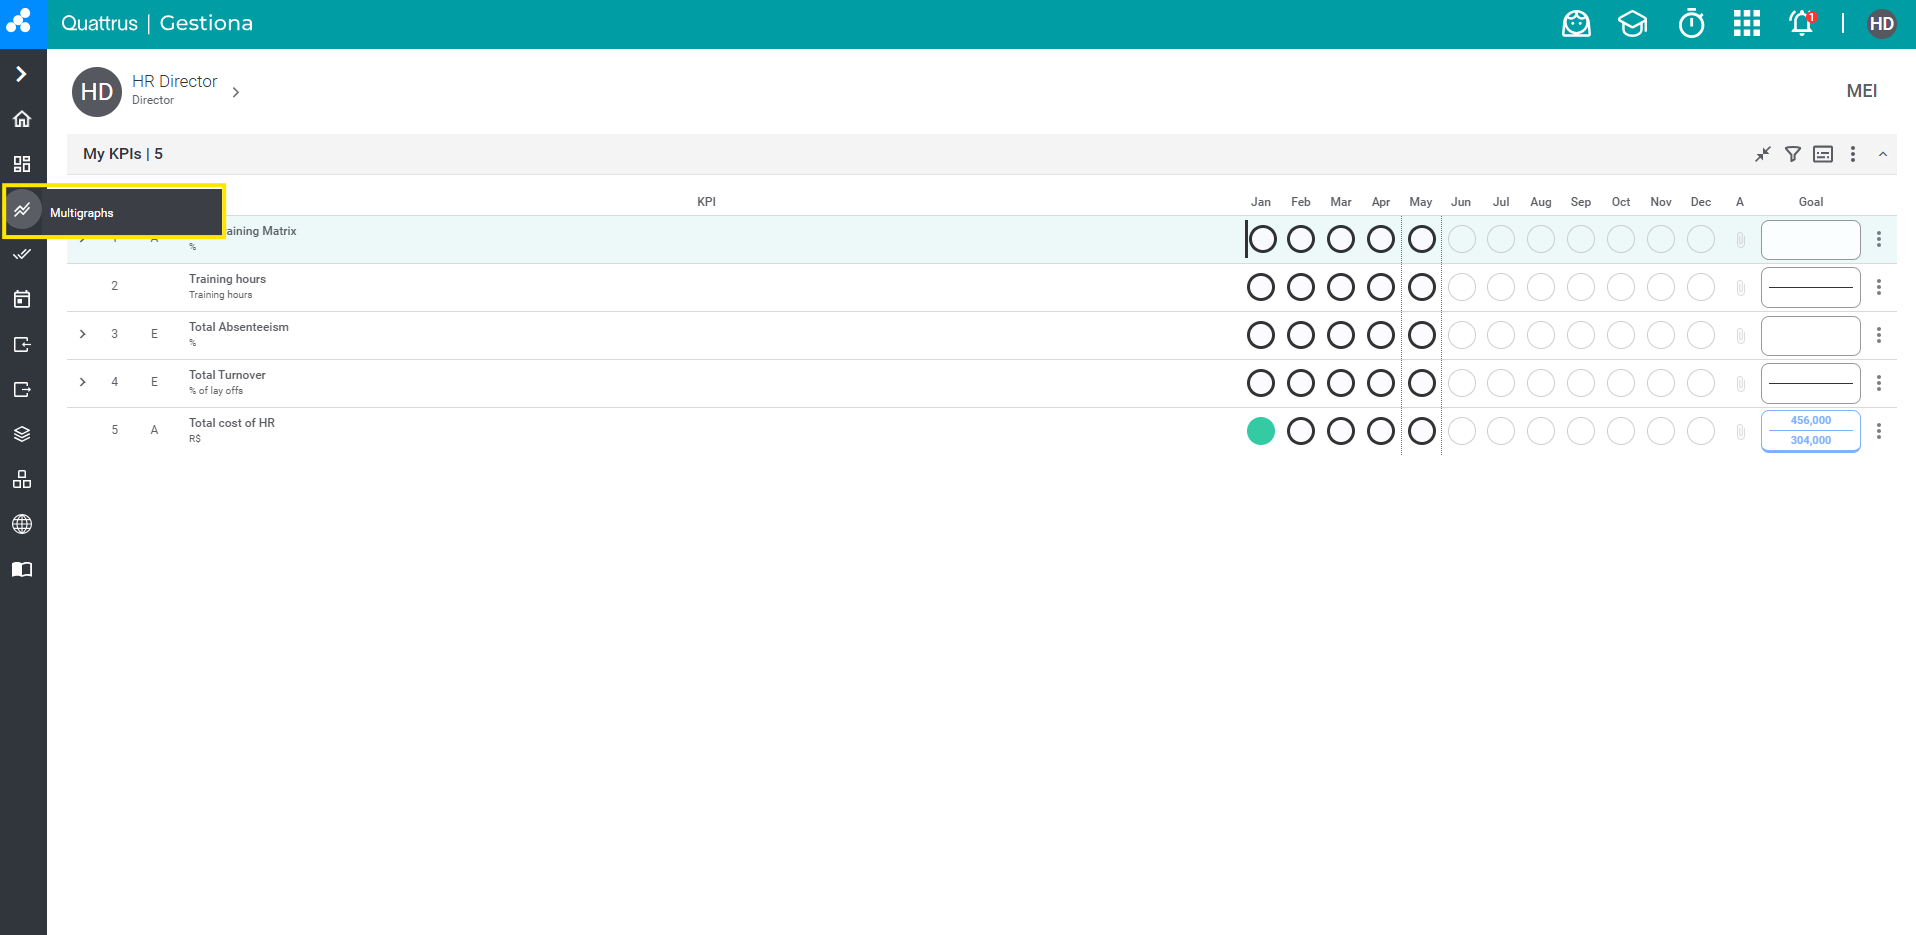
To access it, hover your mouse over the chart icon on the sidebar and then select Multigraphs:
When accessing this feature, the multigraphs screen will initially appear blank. To set up your charts, click on “Manage Charts” or “Add Chart”.
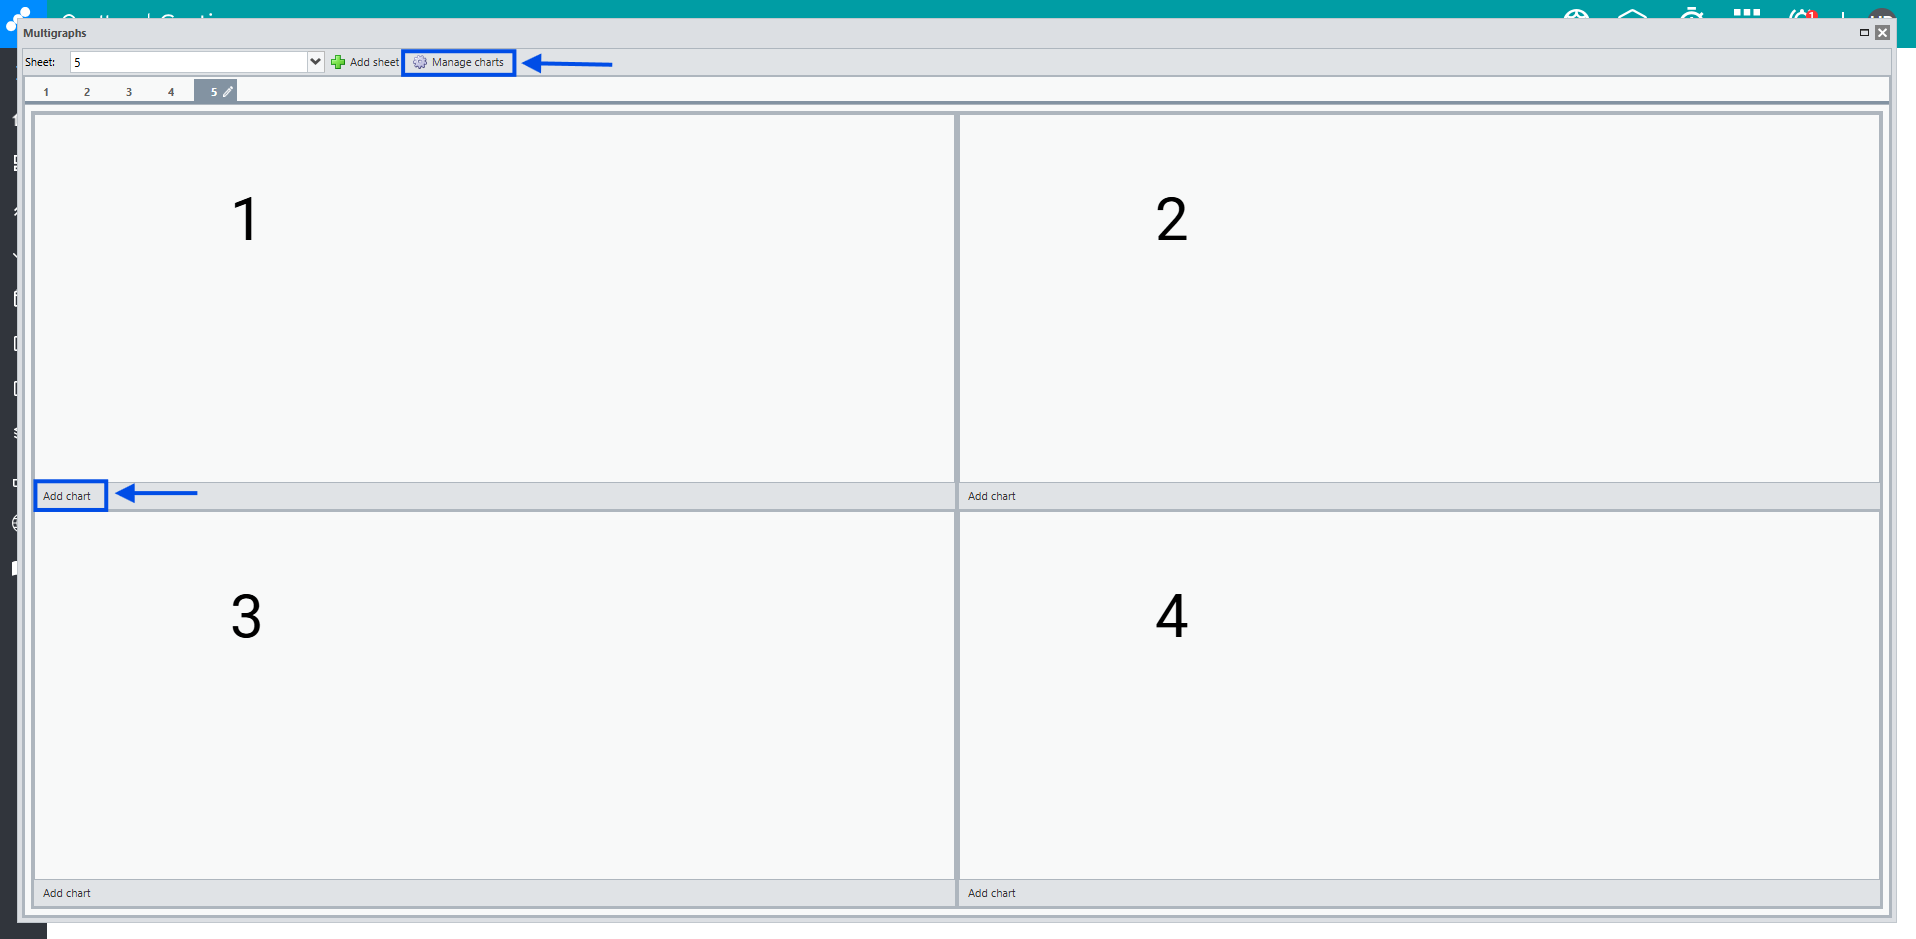
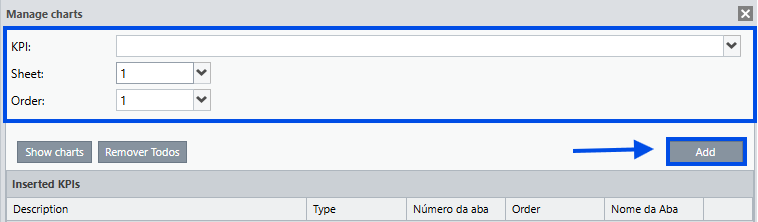
Next, select the KPI, the sheet, and define the chart position on the screen. The positions are determined by the numbers shown in the layout:
1 and 2 correspond to the top part of the screen.
3 and 4 correspond to the bottom part.
Once you’ve configured everything, click “Add” to insert the desired chart, then click “Show Charts”.
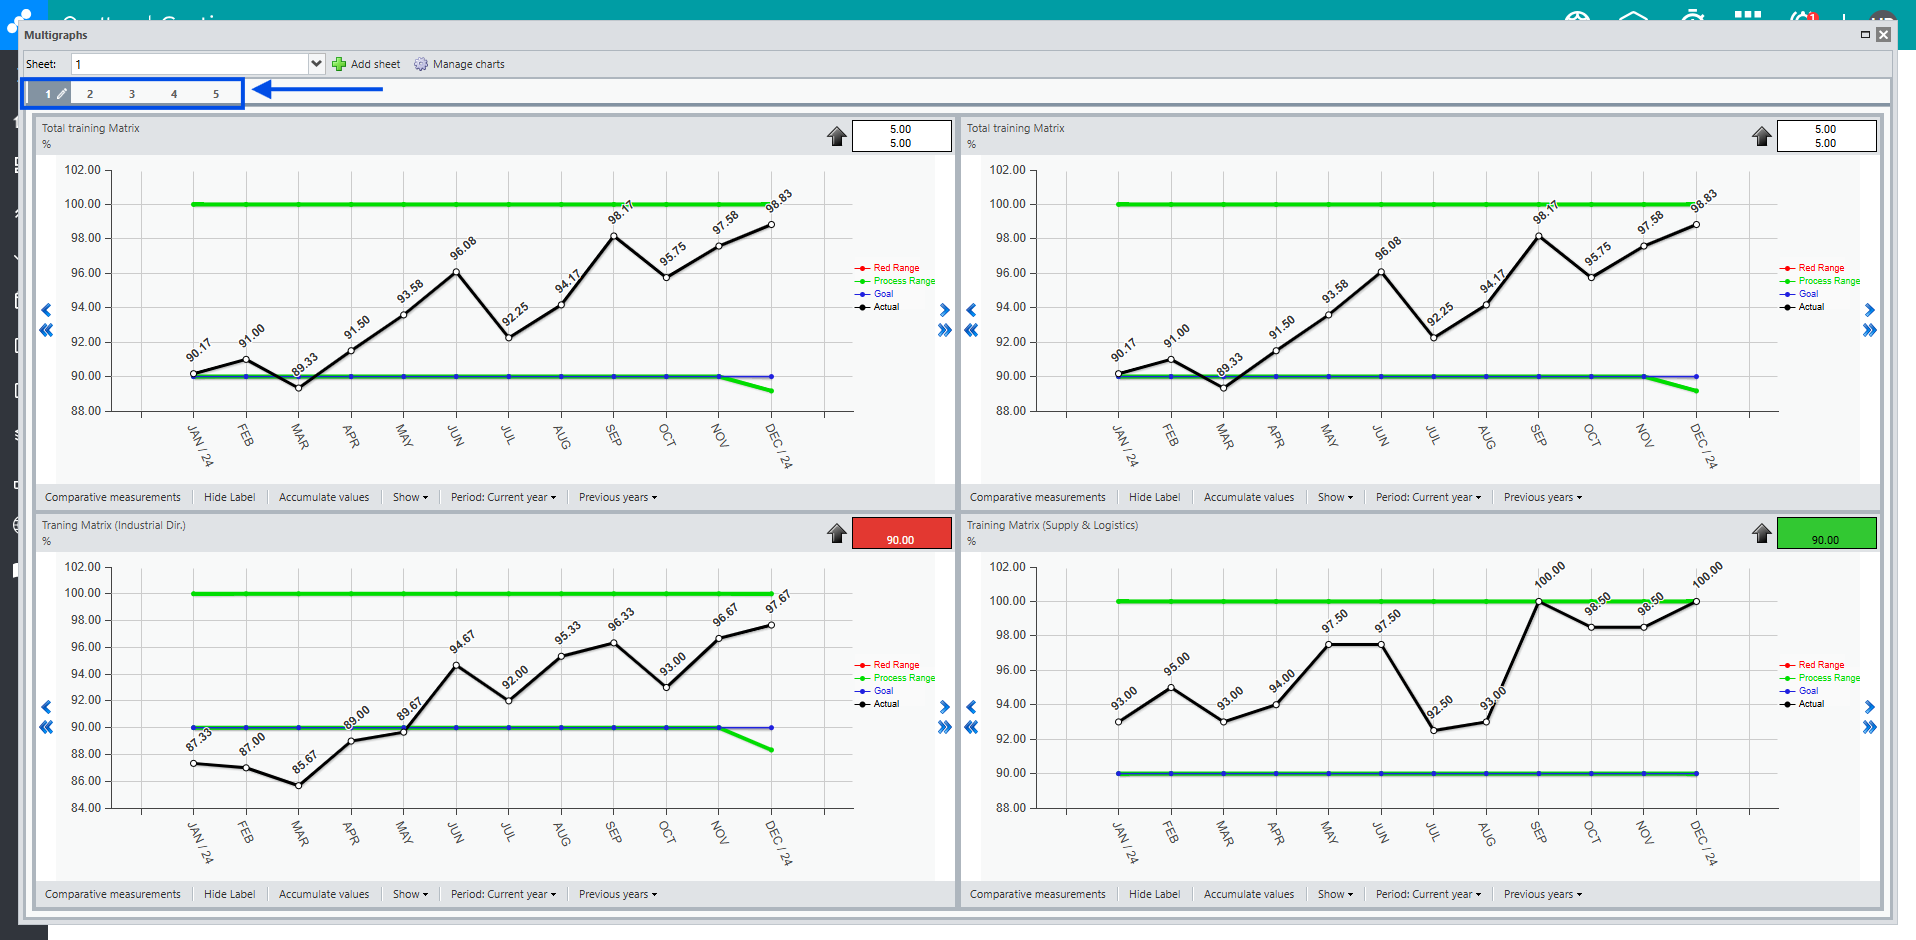
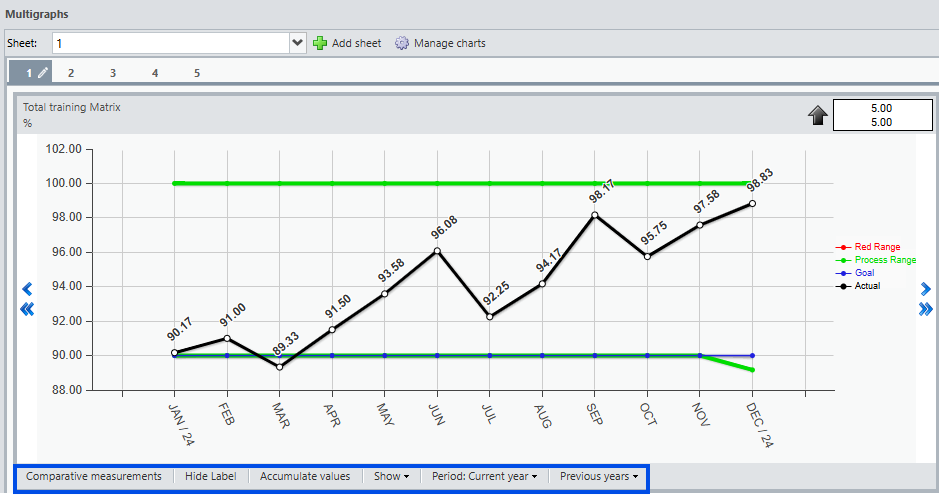
The multigraphs screen will open, displaying the charts you previously configured.
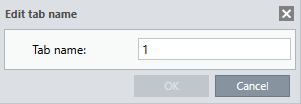
At the top of the charts, you can view the sheets and their respective names. By clicking the pencil icon next to the sheet name, you can edit its name.
Simply edit the tab name and click “OK” to save.
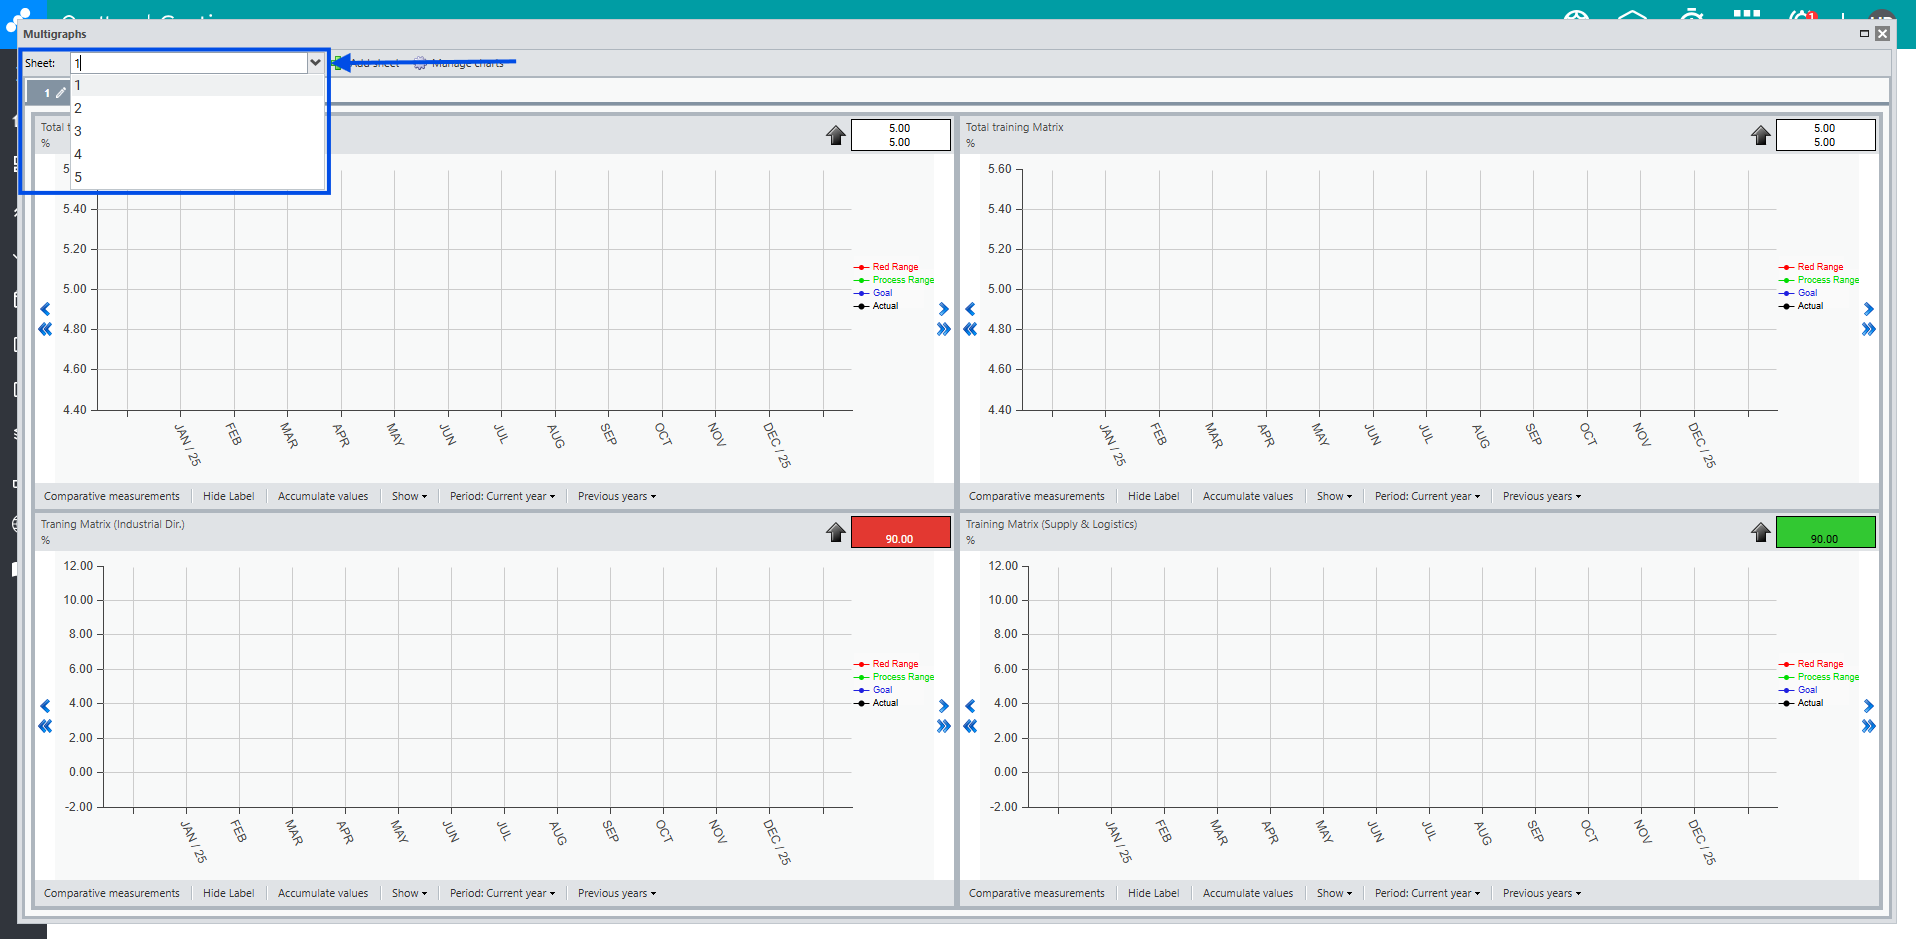
By clicking the arrow button located in the “Sheet” field, the Gestiona system will display a dropdown list with all the multigraph sheets. To view the information of a sheet, select its name or number from the list.
You can change the settings and select options for each chart individually. For more details, refer to the article Item Graph.
REMINDER: When there is more than one sheet, make sure to select the correct one when managing your charts. To view the charts, simply click on the desired tab.
The system automatically saves your changes, so you won’t need to reconfigure the page when closing and reopening it.