[et_pb_section fb_built=”1″ _builder_version=”4.4.8″][et_pb_row column_structure=”1_5,3_5,1_5″ module_class=” et_pb_row_fullwidth” _builder_version=”3.25″ width=”89%” width_tablet=”80%” width_phone=”” width_last_edited=”on|desktop” max_width=”89%” max_width_tablet=”80%” max_width_phone=”” max_width_last_edited=”on|desktop” module_alignment=”center” make_fullwidth=”on”][et_pb_column type=”1_5″ _builder_version=”3.25″ custom_padding=”|||” custom_padding__hover=”|||”][et_pb_text disabled_on=”on|on|” admin_label=”Itens Usuário – Navegação vertical” _builder_version=”4.9.2″ max_width=”100%” z_index_tablet=”500″ saved_tabs=”all” locked=”off”]
[/et_pb_text][et_pb_text disabled_on=”on|on|” admin_label=”Artigos Relacionados” _builder_version=”4.9.2″ text_font=”|600|||||||” text_text_color=”#727272″ header_line_height=”1.1em” header_2_font=”|800||||on|||” header_2_text_align=”left” header_2_text_color=”#494949″ header_3_font=”|600|||||||” header_3_text_color=”#494949″ header_3_font_size=”14px” header_3_line_height=”1.2em” module_alignment=”left” z_index_tablet=”500″ text_text_shadow_horizontal_length_tablet=”0px” text_text_shadow_vertical_length_tablet=”0px” text_text_shadow_blur_strength_tablet=”1px” link_text_shadow_horizontal_length_tablet=”0px” link_text_shadow_vertical_length_tablet=”0px” link_text_shadow_blur_strength_tablet=”1px” ul_text_shadow_horizontal_length_tablet=”0px” ul_text_shadow_vertical_length_tablet=”0px” ul_text_shadow_blur_strength_tablet=”1px” ol_text_shadow_horizontal_length_tablet=”0px” ol_text_shadow_vertical_length_tablet=”0px” ol_text_shadow_blur_strength_tablet=”1px” quote_text_shadow_horizontal_length_tablet=”0px” quote_text_shadow_vertical_length_tablet=”0px” quote_text_shadow_blur_strength_tablet=”1px” header_text_shadow_horizontal_length_tablet=”0px” header_text_shadow_vertical_length_tablet=”0px” header_text_shadow_blur_strength_tablet=”1px” header_2_text_shadow_horizontal_length_tablet=”0px” header_2_text_shadow_vertical_length_tablet=”0px” header_2_text_shadow_blur_strength_tablet=”1px” header_3_text_shadow_horizontal_length_tablet=”0px” header_3_text_shadow_vertical_length_tablet=”0px” header_3_text_shadow_blur_strength_tablet=”1px” header_4_text_shadow_horizontal_length_tablet=”0px” header_4_text_shadow_vertical_length_tablet=”0px” header_4_text_shadow_blur_strength_tablet=”1px” header_5_text_shadow_horizontal_length_tablet=”0px” header_5_text_shadow_vertical_length_tablet=”0px” header_5_text_shadow_blur_strength_tablet=”1px” header_6_text_shadow_horizontal_length_tablet=”0px” header_6_text_shadow_vertical_length_tablet=”0px” header_6_text_shadow_blur_strength_tablet=”1px” box_shadow_horizontal_tablet=”0px” box_shadow_vertical_tablet=”0px” box_shadow_blur_tablet=”40px” box_shadow_spread_tablet=”0px” saved_tabs=”all” locked=”off”]
Related Posts
[/et_pb_text][/et_pb_column][et_pb_column type=”3_5″ _builder_version=”3.25″ custom_padding=”|||” custom_padding__hover=”|||”][et_pb_post_title meta=”off” featured_image=”off” _builder_version=”3.21.1″ title_font=”|700||||on|||” title_font_size=”36px” custom_margin_tablet=”||40px” custom_margin_phone=”” custom_margin_last_edited=”on|phone”][/et_pb_post_title][et_pb_text _builder_version=”4.9.7″ custom_margin=”-45px||0px” custom_padding=”20px|15px|20px|15px|true|true” hover_enabled=”0″ border_width_top=”5px” border_color_top=”#0c71c3″ border_width_right=”1px” border_color_right=”#d6d6d6″ border_width_bottom=”1px” border_color_bottom=”#d6d6d6″ border_width_left=”1px” border_color_left=”#d6d6d6″ box_shadow_style=”preset3″ sticky_enabled=”0″]
Vilfredo Pareto was a sociologist and economist who, in 1897, created the 80/20 method. The Pareto Principle says that by focusing on 20% of potential causes, 80% of problems tend to be resolved. Essentially, Pareto showed that approximately 80% of the effects come from 20% of the causes.
The Pareto Chart is a tool to help focus improvement efforts, it is important to note that its purpose is not to identify the causes of the problem, for this, use the FCA tool.
The chart is constructed as follows:
– The occurrence of problems is shown on the left and the Accumulated Value on the right.
– The bars represent the problems that have occurred, it is important that they are organized in a decreasing way.
– The black line is the representation of the Accumulated Value.
By drawing a line that represents 80% of the Accumulated Value and another line up to the X Axis, you will find what problems you should focus on. The problems to the left of this line should be prioritized.
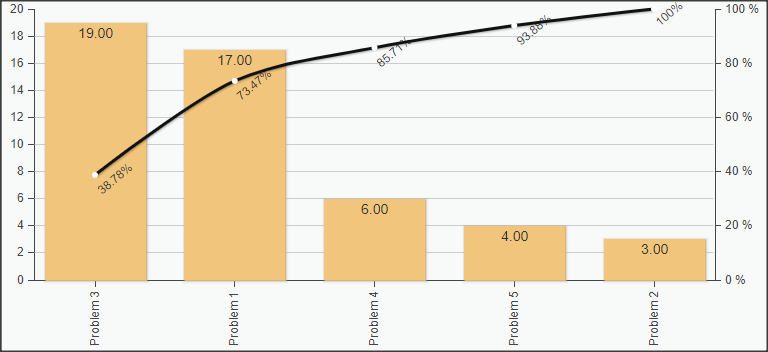
In this case, Problems 4, 1 and 5 should be prioritized.
[/et_pb_text][/et_pb_column][et_pb_column type=”1_5″ _builder_version=”3.25″ custom_padding=”|||” custom_padding__hover=”|||”][et_pb_image src=”https://suporte.quattrus.com/wp-content/uploads/2021/03/Artboard-2-copy-5.jpg” title_text=”Artboard 2 copy 5″ align_tablet=”center” align_phone=”” align_last_edited=”on|desktop” disabled_on=”on|on|” admin_label=”ESP – Banner – Contato Suporte” _builder_version=”4.9.2″ z_index=”0″ always_center_on_mobile=”on” saved_tabs=”all” locked=”off”][/et_pb_image][et_pb_image src=”https://suporte.quattrus.com/wp-content/uploads/2021/03/Prancheta-1.jpg” title_text=”Prancheta 1″ url=”https://www.qualitin.com.br/consultoria/” url_new_window=”on” align_tablet=”center” align_phone=”” align_last_edited=”on|desktop” disabled_on=”on|on|” admin_label=”Banner – Consultoria” _builder_version=”4.9.2″ max_width=”100%” saved_tabs=”all” locked=”off”][/et_pb_image][/et_pb_column][/et_pb_row][/et_pb_section]


 Português