[et_pb_section fb_built=”1″ _builder_version=”4.4.8″ global_colors_info=”{}”][et_pb_row column_structure=”1_5,3_5,1_5″ module_class=” et_pb_row_fullwidth” _builder_version=”3.25″ width=”89%” width_tablet=”80%” width_phone=”” width_last_edited=”on|desktop” max_width=”89%” max_width_tablet=”80%” max_width_phone=”” max_width_last_edited=”on|desktop” make_fullwidth=”on” global_colors_info=”{}”][et_pb_column type=”1_5″ _builder_version=”3.25″ custom_padding=”|||” global_colors_info=”{}” custom_padding__hover=”|||”][et_pb_text disabled_on=”on|on|” admin_label=”Itens Usuário – Navegação vertical” _builder_version=”4.9.2″ max_width=”100%” z_index_tablet=”500″ saved_tabs=”all” locked=”off” global_colors_info=”{}”]
[/et_pb_text][et_pb_text disabled_on=”on|on|” admin_label=”Artigos Relacionados” _builder_version=”4.9.2″ text_font=”|600|||||||” text_text_color=”#727272″ header_line_height=”1.1em” header_2_font=”|800||||on|||” header_2_text_align=”left” header_2_text_color=”#494949″ header_3_font=”|600|||||||” header_3_text_color=”#494949″ header_3_font_size=”14px” header_3_line_height=”1.2em” module_alignment=”left” z_index_tablet=”500″ text_text_shadow_horizontal_length_tablet=”0px” text_text_shadow_vertical_length_tablet=”0px” text_text_shadow_blur_strength_tablet=”1px” link_text_shadow_horizontal_length_tablet=”0px” link_text_shadow_vertical_length_tablet=”0px” link_text_shadow_blur_strength_tablet=”1px” ul_text_shadow_horizontal_length_tablet=”0px” ul_text_shadow_vertical_length_tablet=”0px” ul_text_shadow_blur_strength_tablet=”1px” ol_text_shadow_horizontal_length_tablet=”0px” ol_text_shadow_vertical_length_tablet=”0px” ol_text_shadow_blur_strength_tablet=”1px” quote_text_shadow_horizontal_length_tablet=”0px” quote_text_shadow_vertical_length_tablet=”0px” quote_text_shadow_blur_strength_tablet=”1px” header_text_shadow_horizontal_length_tablet=”0px” header_text_shadow_vertical_length_tablet=”0px” header_text_shadow_blur_strength_tablet=”1px” header_2_text_shadow_horizontal_length_tablet=”0px” header_2_text_shadow_vertical_length_tablet=”0px” header_2_text_shadow_blur_strength_tablet=”1px” header_3_text_shadow_horizontal_length_tablet=”0px” header_3_text_shadow_vertical_length_tablet=”0px” header_3_text_shadow_blur_strength_tablet=”1px” header_4_text_shadow_horizontal_length_tablet=”0px” header_4_text_shadow_vertical_length_tablet=”0px” header_4_text_shadow_blur_strength_tablet=”1px” header_5_text_shadow_horizontal_length_tablet=”0px” header_5_text_shadow_vertical_length_tablet=”0px” header_5_text_shadow_blur_strength_tablet=”1px” header_6_text_shadow_horizontal_length_tablet=”0px” header_6_text_shadow_vertical_length_tablet=”0px” header_6_text_shadow_blur_strength_tablet=”1px” box_shadow_horizontal_tablet=”0px” box_shadow_vertical_tablet=”0px” box_shadow_blur_tablet=”40px” box_shadow_spread_tablet=”0px” saved_tabs=”all” locked=”off” global_colors_info=”{}”]
Related Posts
[/et_pb_text][/et_pb_column][et_pb_column type=”3_5″ _builder_version=”3.25″ custom_padding=”|||” global_colors_info=”{}” custom_padding__hover=”|||”][et_pb_post_title meta=”off” featured_image=”off” _builder_version=”3.19.17″ title_font=”|700||||on|||” title_font_size=”36px” border_width_bottom=”5px” border_color_bottom=”#0c71c3″ global_colors_info=”{}”][/et_pb_post_title][et_pb_video src=”https://youtu.be/D1jZmZMDULA” _builder_version=”4.6.0″ _module_preset=”default” global_colors_info=”{}”][/et_pb_video][et_pb_text _builder_version=”4.14.8″ custom_margin=”-50px|||||false” custom_padding=”20px|25px||25px||true” hover_enabled=”0″ border_color_top=”#0c71c3″ global_colors_info=”{}” sticky_enabled=”0″]
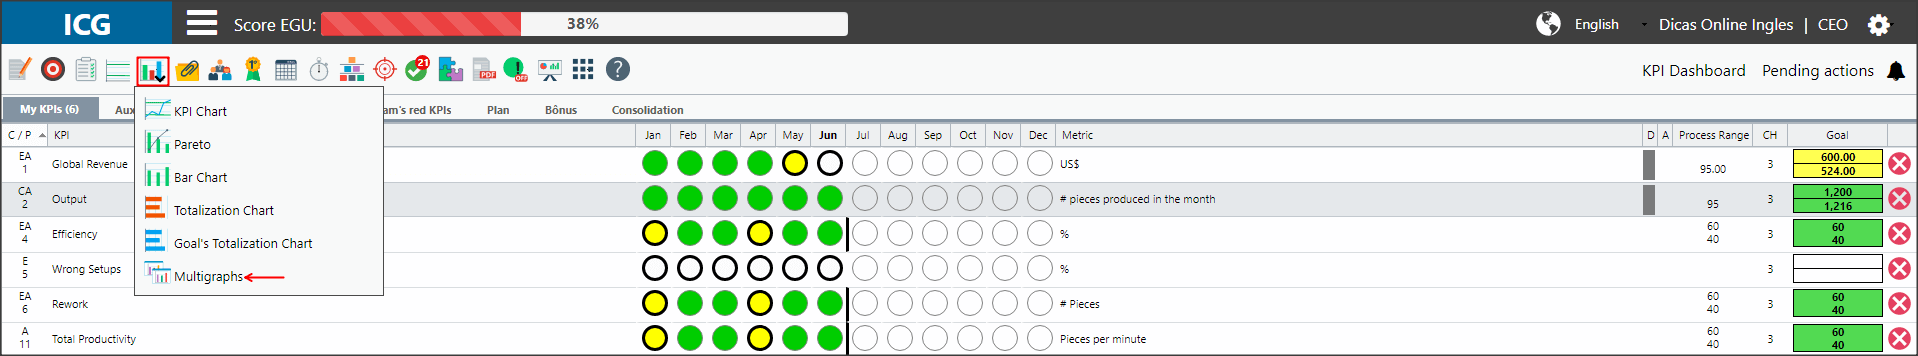
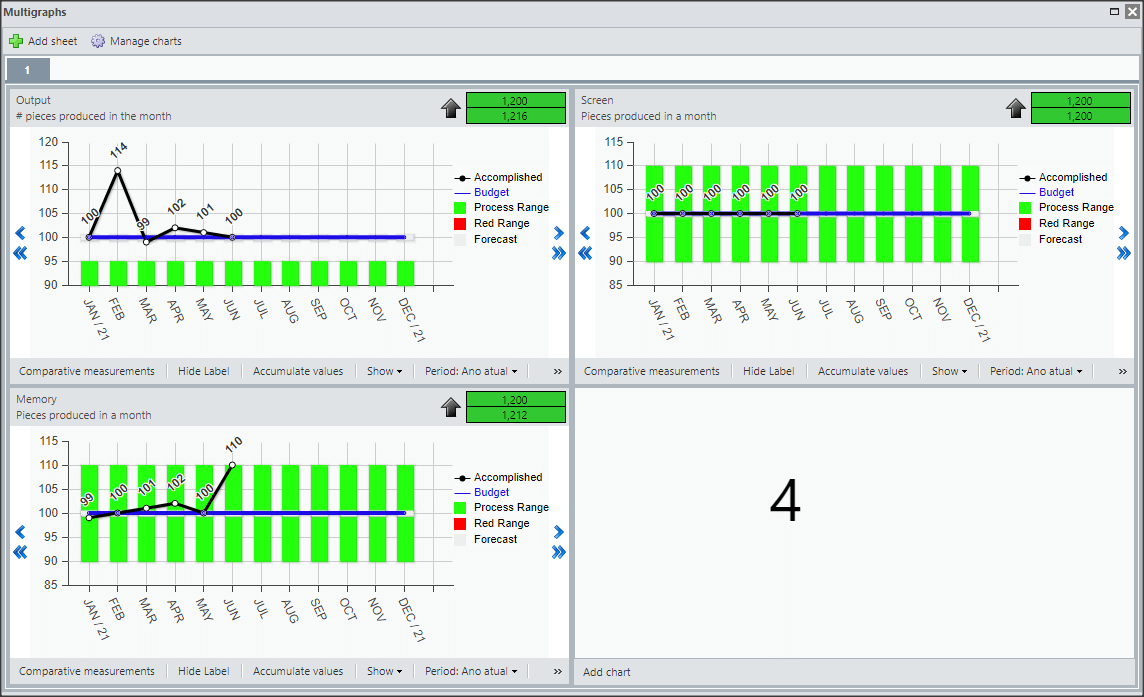
The multigraphs function allows you to view up to four charts at the same time, facilitating comparisons and presentations of KPIs.
To access, click on the charts icon and then select the option Multicharts:
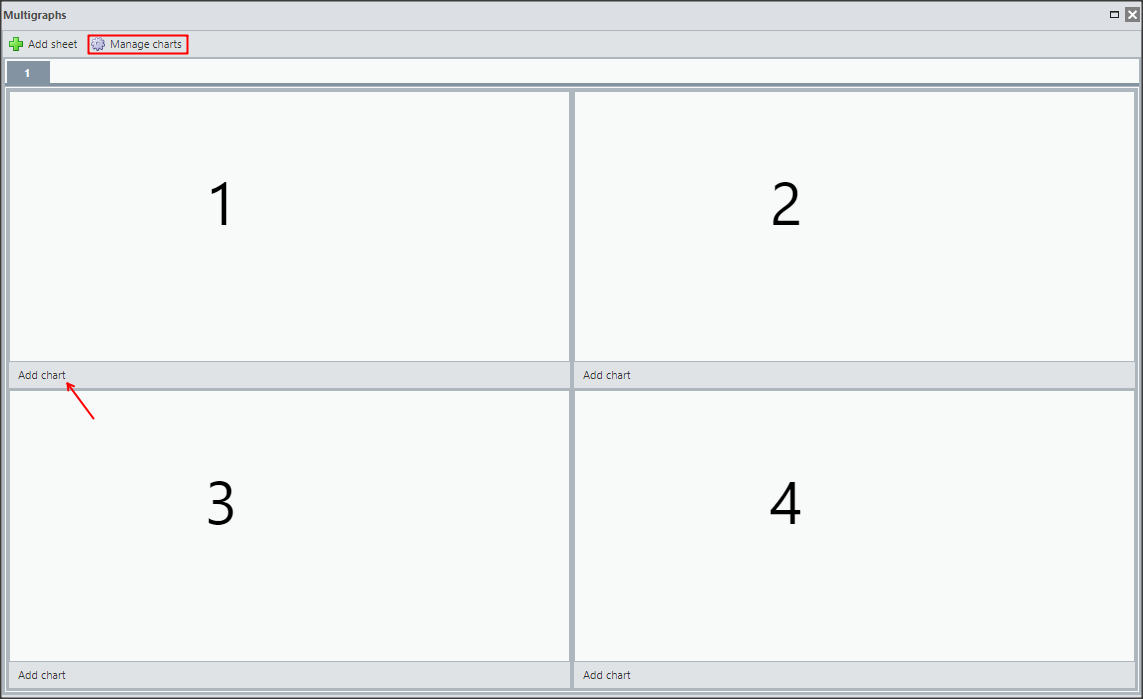
The system will open the multigraphsscreen. It will be blank, since it is first necessary to configure the charts that will be displayed.
Click Manage Charts or Add Chart.
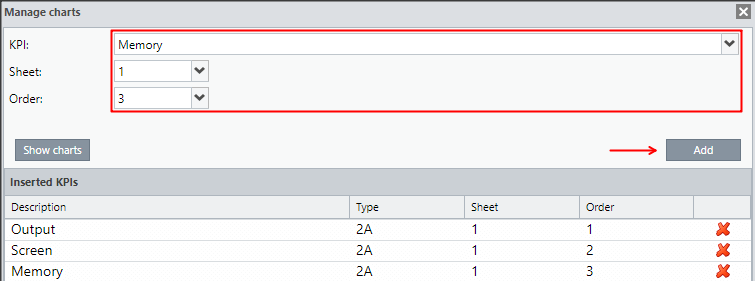
Select the KPI, the tab and the order.
The positions are according to the numbers shown previously on the multigraphs screen, with 1 and 2 for the top and 3 and 4 for the bottom.
Then click Add.
After configuring all the KPIs, click on “Show Charts”.
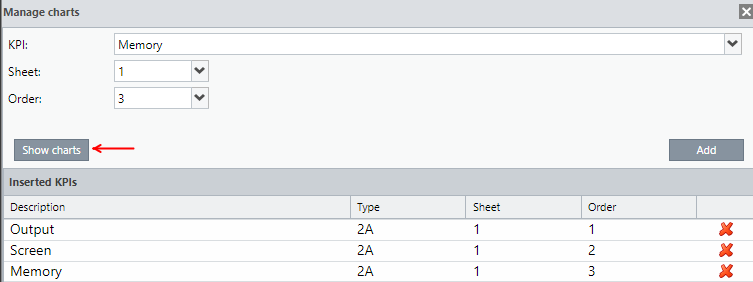
It will open the screen of the multigraphs containing the previously configured KPI.
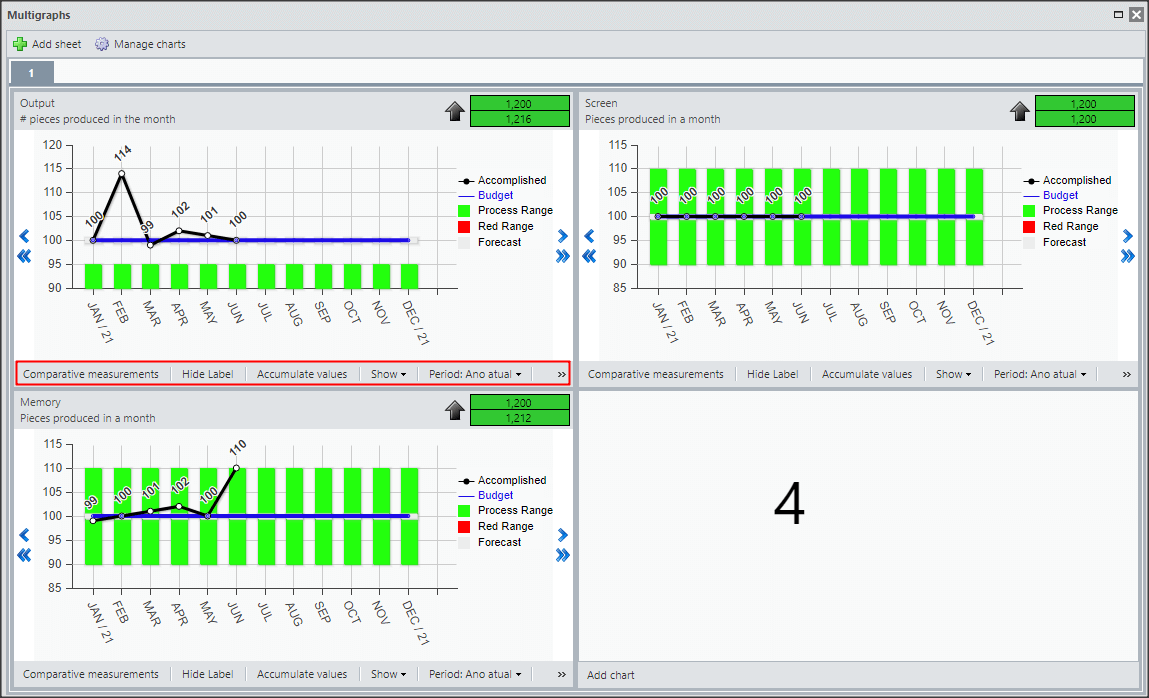
You can change the settings and select options for each of the charts individually. For more information, visit the KPI Chart article.
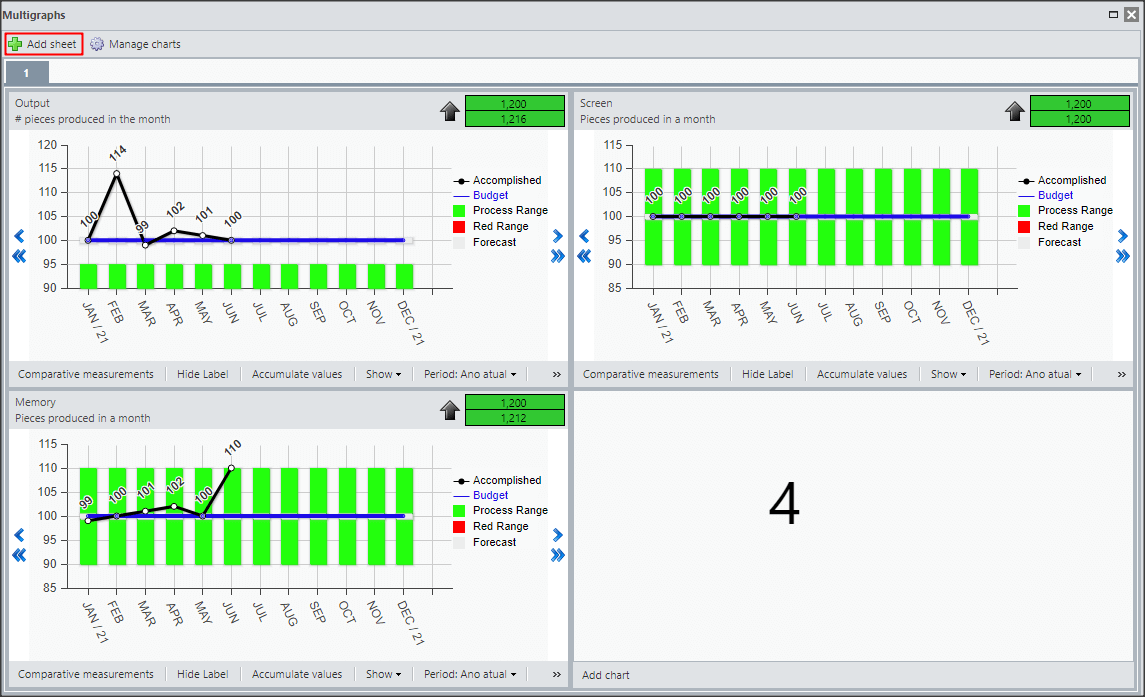
If necessary, you can add tabs and make settings for each tab.
[/et_pb_text][et_pb_text _builder_version=”4.9.7″ background_color=”rgba(70,147,42,0.27)” custom_margin=”-30px|65px|30px|70px” custom_margin_tablet=”-20px||20px” custom_margin_phone=”|25px||50px” custom_margin_last_edited=”on|phone” custom_padding=”10px|15px|10px|20px|true” border_width_left=”5px” border_color_left=”rgba(0,48,3,0.34)” box_shadow_style=”preset3″ saved_tabs=”all” global_colors_info=”{}”]
Reminder:
When there is more than one tab, pay attention when managing the charts to select the correct tab.
[/et_pb_text][et_pb_text _builder_version=”4.9.7″ custom_margin=”|||||false” custom_padding=”|25px||25px||true” global_colors_info=”{}”]
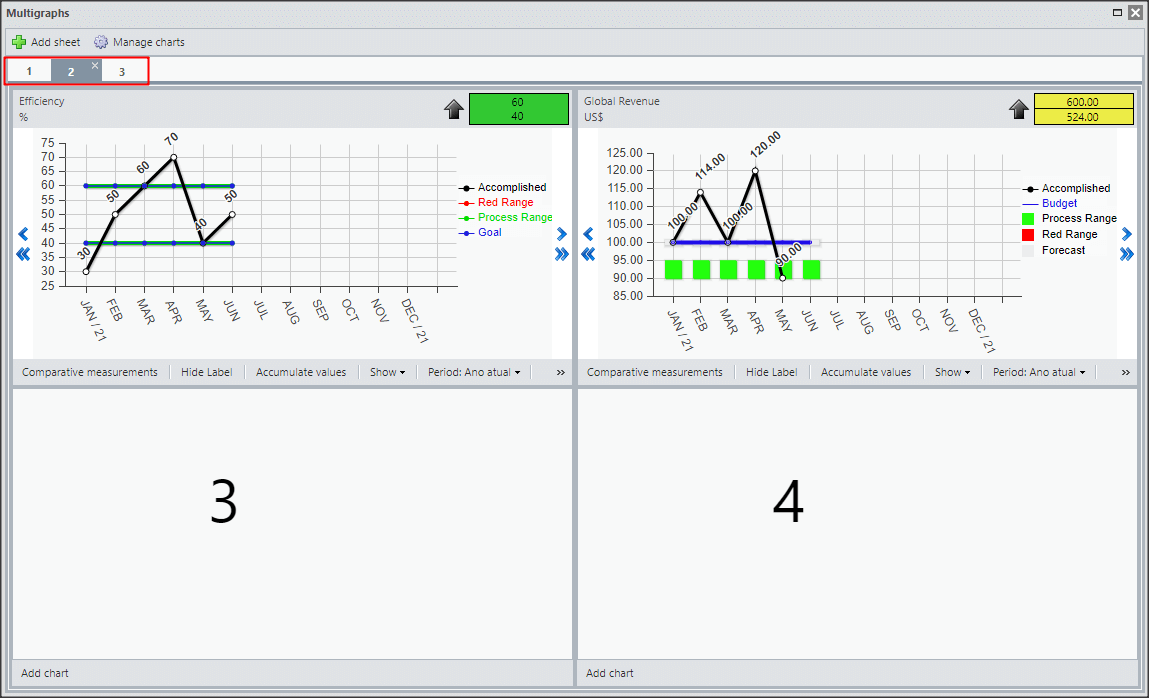
To view the charts, just click on the tab you want.
[/et_pb_text][et_pb_text admin_label=”Borda Inferior” _builder_version=”3.27.4″ custom_margin=”-40px|||||false” custom_padding=”|25px||25px||true” box_shadow_style=”preset3″ global_colors_info=”{}”]
TESTE
[/et_pb_text][/et_pb_column][et_pb_column type=”1_5″ _builder_version=”3.25″ custom_padding=”|||” global_colors_info=”{}” custom_padding__hover=”|||”][et_pb_image src=”https://suporte.quattrus.com/wp-content/uploads/2021/03/Artboard-2-copy-5.jpg” title_text=”Artboard 2 copy 5″ align_tablet=”center” align_phone=”” align_last_edited=”on|desktop” disabled_on=”on|on|” admin_label=”ESP – Banner – Contato Suporte” _builder_version=”4.9.2″ z_index=”0″ always_center_on_mobile=”on” saved_tabs=”all” locked=”off” global_colors_info=”{}”][/et_pb_image][et_pb_image src=”https://suporte.quattrus.com/wp-content/uploads/2021/03/Prancheta-1.jpg” title_text=”Prancheta 1″ url=”https://www.qualitin.com.br/consultoria/” url_new_window=”on” align_tablet=”center” align_phone=”” align_last_edited=”on|desktop” disabled_on=”on|on|” admin_label=”Banner – Consultoria” _builder_version=”4.9.2″ max_width=”100%” saved_tabs=”all” locked=”off” global_colors_info=”{}”][/et_pb_image][/et_pb_column][/et_pb_row][/et_pb_section]


 Português