

 Português
[/et_pb_text][et_pb_text disabled_on=”on|on|” admin_label=”Artigos Relacionados” _builder_version=”4.9.2″ text_font=”|600|||||||” text_text_color=”#727272″ header_line_height=”1.1em” header_2_font=”|800||||on|||” header_2_text_align=”left” header_2_text_color=”#494949″ header_3_font=”|600|||||||” header_3_text_color=”#494949″ header_3_font_size=”14px” header_3_line_height=”1.2em” module_alignment=”left” z_index_tablet=”500″ text_text_shadow_horizontal_length_tablet=”0px” text_text_shadow_vertical_length_tablet=”0px” text_text_shadow_blur_strength_tablet=”1px” link_text_shadow_horizontal_length_tablet=”0px” link_text_shadow_vertical_length_tablet=”0px” link_text_shadow_blur_strength_tablet=”1px” ul_text_shadow_horizontal_length_tablet=”0px” ul_text_shadow_vertical_length_tablet=”0px” ul_text_shadow_blur_strength_tablet=”1px” ol_text_shadow_horizontal_length_tablet=”0px” ol_text_shadow_vertical_length_tablet=”0px” ol_text_shadow_blur_strength_tablet=”1px” quote_text_shadow_horizontal_length_tablet=”0px” quote_text_shadow_vertical_length_tablet=”0px” quote_text_shadow_blur_strength_tablet=”1px” header_text_shadow_horizontal_length_tablet=”0px” header_text_shadow_vertical_length_tablet=”0px” header_text_shadow_blur_strength_tablet=”1px” header_2_text_shadow_horizontal_length_tablet=”0px” header_2_text_shadow_vertical_length_tablet=”0px” header_2_text_shadow_blur_strength_tablet=”1px” header_3_text_shadow_horizontal_length_tablet=”0px” header_3_text_shadow_vertical_length_tablet=”0px” header_3_text_shadow_blur_strength_tablet=”1px” header_4_text_shadow_horizontal_length_tablet=”0px” header_4_text_shadow_vertical_length_tablet=”0px” header_4_text_shadow_blur_strength_tablet=”1px” header_5_text_shadow_horizontal_length_tablet=”0px” header_5_text_shadow_vertical_length_tablet=”0px” header_5_text_shadow_blur_strength_tablet=”1px” header_6_text_shadow_horizontal_length_tablet=”0px” header_6_text_shadow_vertical_length_tablet=”0px” header_6_text_shadow_blur_strength_tablet=”1px” box_shadow_horizontal_tablet=”0px” box_shadow_vertical_tablet=”0px” box_shadow_blur_tablet=”40px” box_shadow_spread_tablet=”0px” saved_tabs=”all” locked=”off”]
Related Posts
[/et_pb_text][/et_pb_column][et_pb_column type=”3_5″ _builder_version=”3.25″ custom_padding=”|||” custom_padding__hover=”|||”][et_pb_post_title meta=”off” featured_image=”off” _builder_version=”3.19.17″ title_font=”|700||||on|||” title_font_size=”36px” border_width_bottom=”5px” border_color_bottom=”#0c71c3″] [/et_pb_post_title][et_pb_text admin_label=”Importante” _builder_version=”4.9.7″ background_color=”rgba(70,168,201,0.34)” custom_margin=”-25px|65px|30px|70px||false” custom_margin_tablet=”-15px||” custom_margin_phone=”|25px||50px” custom_margin_last_edited=”on|phone” custom_padding=”10px|15px|10px|20px|true” border_width_left=”5px” border_color_left=”rgba(32,159,201,0.59)” box_shadow_style=”preset3″ saved_tabs=”all”]
RELATED ARTICLES:
The structure of the Bar Chart is similar to that of Pareto, so you can access the articles below to create a new chart, copy the structure and / or view usability tips.
Pareto: How to do it
Pareto: Copy Structure
Pareto: Usability Tips
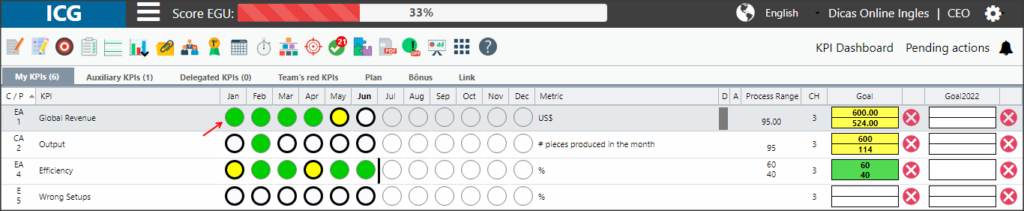
When there is a beacon with the indication of an arrow, as shown below, it means that in that month there is a pareto or a bar chart.
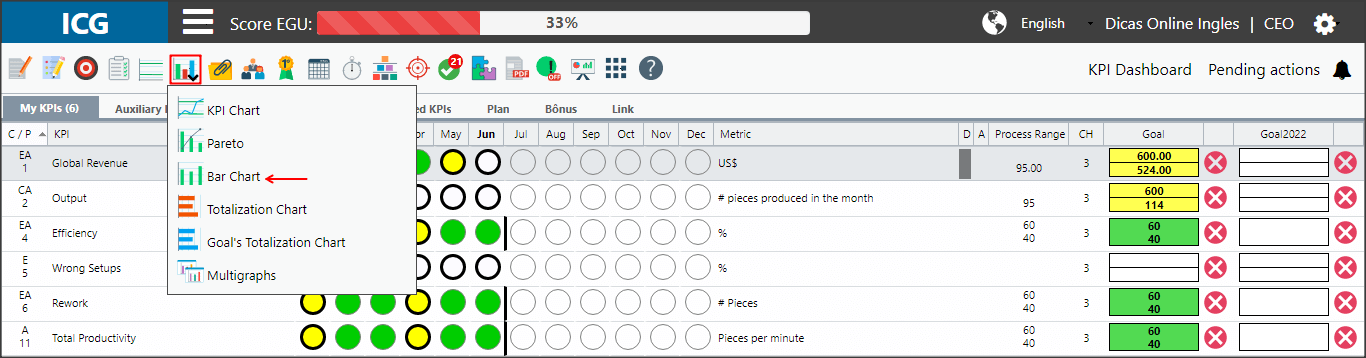
Select the desired month, click on the chart’s icon and select the Bar Chart option.
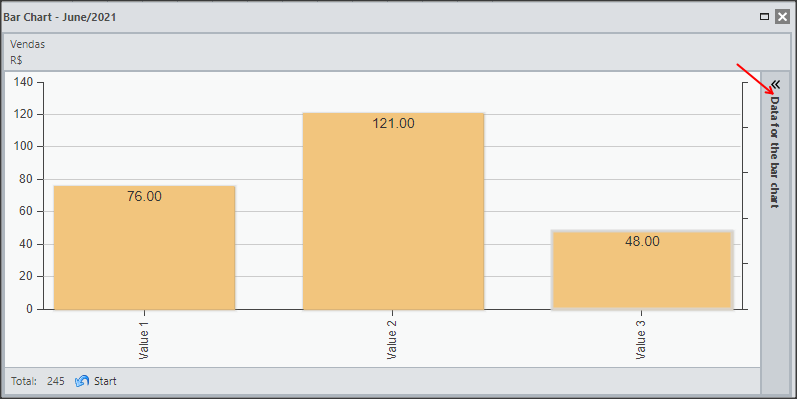
You will see the Bar Chart. To view the structure, click on Bar Chart Data.
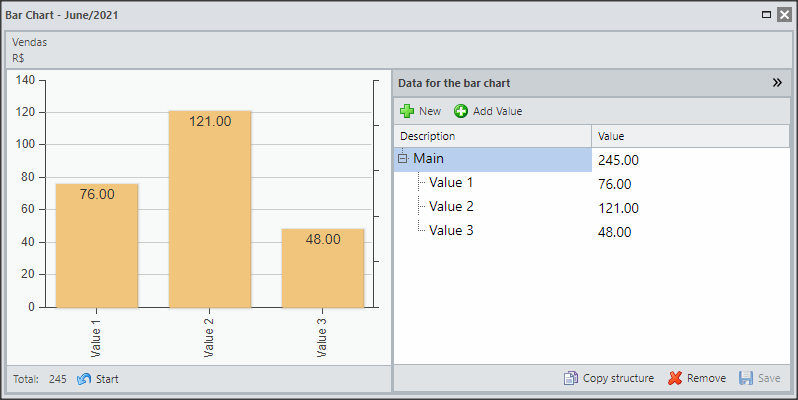
In this way it will be possible to view the structure of the Bar Chart.
TESTE
[/et_pb_text][/et_pb_column][et_pb_column type=”1_5″ _builder_version=”3.25″ custom_padding=”|||” custom_padding__hover=”|||”][et_pb_image src=”https://suporte.quattrus.com/wp-content/uploads/2021/03/Artboard-2-copy-5.jpg” title_text=”Artboard 2 copy 5″ align_tablet=”center” align_phone=”” align_last_edited=”on|desktop” disabled_on=”on|on|” admin_label=”ESP – Banner – Contato Suporte” _builder_version=”4.9.2″ z_index=”0″ always_center_on_mobile=”on” saved_tabs=”all” locked=”off”][/et_pb_image][et_pb_image src=”https://suporte.quattrus.com/wp-content/uploads/2021/03/Prancheta-1.jpg” title_text=”Prancheta 1″ url=”https://www.qualitin.com.br/consultoria/” url_new_window=”on” align_tablet=”center” align_phone=”” align_last_edited=”on|desktop” disabled_on=”on|on|” admin_label=”Banner – Consultoria” _builder_version=”4.9.2″ max_width=”100%” saved_tabs=”all” locked=”off”][/et_pb_image][/et_pb_column][/et_pb_row][/et_pb_section]